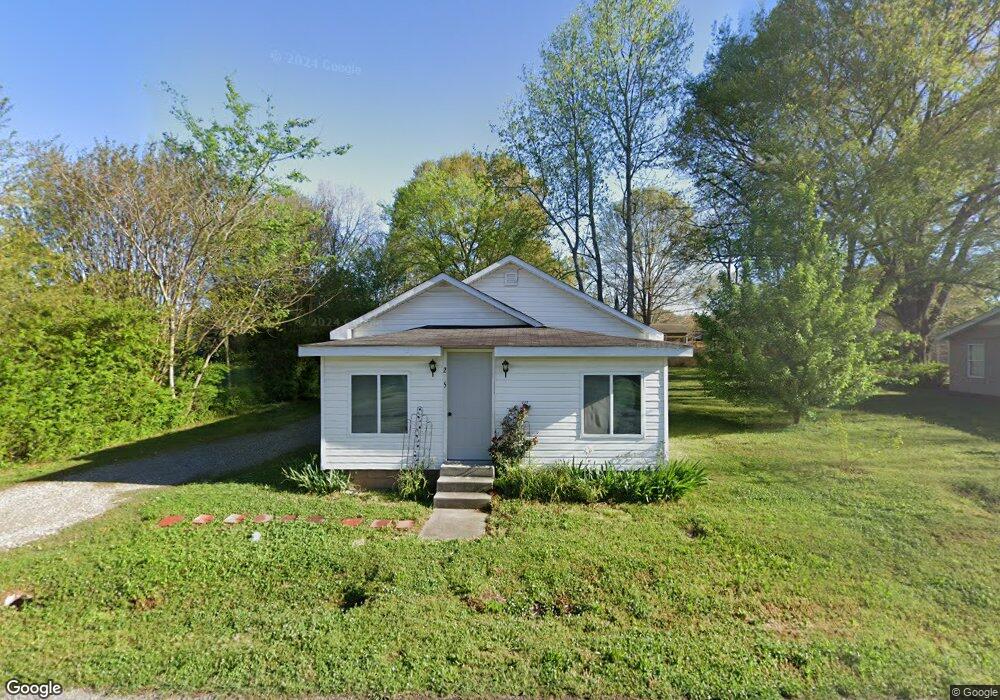
215 Lynn Ln Cedartown, GA 30125
Estimated Value: $138,455 - $170,000
3
Beds
1
Bath
994
Sq Ft
$153/Sq Ft
Est. Value
About This Home
This home is located at 215 Lynn Ln, Cedartown, GA 30125 and is currently estimated at $151,864, approximately $152 per square foot. 215 Lynn Ln is a home located in Polk County with nearby schools including Vineyard Harvester Christian Academy and Cedar Christian School.
Ownership History
Date
Name
Owned For
Owner Type
Purchase Details
Closed on
Sep 16, 2019
Sold by
Bell Joran
Bought by
Labelle Dawson Ceara
Current Estimated Value
Home Financials for this Owner
Home Financials are based on the most recent Mortgage that was taken out on this home.
Original Mortgage
$75,605
Outstanding Balance
$66,224
Interest Rate
3.6%
Mortgage Type
FHA
Estimated Equity
$85,640
Purchase Details
Closed on
May 6, 2002
Sold by
Brown Leroy I
Bought by
Bell Joran
Purchase Details
Closed on
Jul 9, 2001
Sold by
Williams Janice Carlon and Judy Ann Parnel
Bought by
Brown Leroy I
Purchase Details
Closed on
Nov 9, 2000
Sold by
Hayes Vernia Mae
Bought by
Williams Mrs Janice Carlon
Purchase Details
Closed on
Mar 31, 1967
Sold by
Miller Esther F
Bought by
Hayes Roscoe
Purchase Details
Closed on
Aug 10, 1964
Sold by
Carroll B S
Bought by
Miller Esther F
Purchase Details
Closed on
Aug 6, 1964
Sold by
Reddish Robert
Bought by
Carroll B S
Purchase Details
Closed on
Sep 3, 1960
Bought by
Reddish Robert
Create a Home Valuation Report for This Property
The Home Valuation Report is an in-depth analysis detailing your home's value as well as a comparison with similar homes in the area
Home Values in the Area
Average Home Value in this Area
Purchase History
| Date | Buyer | Sale Price | Title Company |
|---|---|---|---|
| Labelle Dawson Ceara | $77,000 | -- | |
| Bell Joran | $29,700 | -- | |
| Brown Leroy I | $20,000 | -- | |
| Williams Mrs Janice Carlon | -- | -- | |
| Hayes Roscoe | -- | -- | |
| Miller Esther F | -- | -- | |
| Carroll B S | -- | -- | |
| Reddish Robert | -- | -- |
Source: Public Records
Mortgage History
| Date | Status | Borrower | Loan Amount |
|---|---|---|---|
| Open | Labelle Dawson Ceara | $75,605 |
Source: Public Records
Tax History Compared to Growth
Tax History
| Year | Tax Paid | Tax Assessment Tax Assessment Total Assessment is a certain percentage of the fair market value that is determined by local assessors to be the total taxable value of land and additions on the property. | Land | Improvement |
|---|---|---|---|---|
| 2024 | $1,342 | $42,495 | $1,800 | $40,695 |
| 2023 | $921 | $26,576 | $1,800 | $24,776 |
| 2022 | $535 | $22,556 | $1,800 | $20,756 |
| 2021 | $542 | $22,556 | $1,800 | $20,756 |
| 2020 | $543 | $22,556 | $1,800 | $20,756 |
| 2019 | $551 | $20,501 | $1,755 | $18,746 |
| 2018 | $475 | $17,233 | $1,755 | $15,478 |
| 2017 | $374 | $13,762 | $1,755 | $12,007 |
| 2016 | $374 | $13,762 | $1,755 | $12,007 |
| 2015 | $255 | $9,356 | $1,755 | $7,601 |
| 2014 | $257 | $9,356 | $1,755 | $7,601 |
Source: Public Records
Map
Nearby Homes
- 812 Blanche Rd
- 207 John Phillips Rd
- 292 Kimwood Dr
- 362 Oakwood Dr
- 220 Greenbriar Dr
- 462 Oakwood Dr
- 77 Ben Dr W
- 0 Woodlawn Dr Unit 7638056
- 0 Woodlawn Dr Unit 10590789
- 254 E Girard Ave
- 403 Lakeside Dr
- 112 College Cir
- 12 Breckenridge Dr
- 64 Virginia Cir
- 109 Perry St
- 214 Jule Peek Ave
- 133 Virginia Cir
- 521 W John Hand Rd
- 607 N College St
- 228 Marshall St
- 219 Lynn Ln
- 211 Lynn Ln
- 214 Lynn Ln
- 0 Lynn Ln Unit 20024378
- 218 Plantation Ave
- 214 Plantation Ave
- 222 Plantation Ave
- 810 Smith Ave
- 210 Plantation Ave
- 815 Montgomery Ave
- 206 Plantation Ave
- 215 Plantation Ave
- 805 Smith Ave
- 226 Plantation Ave
- 809 Montgomery Ave
- 223 Plantation Ave
- 207 Plantation Ave
- 202 Plantation Ave
- 211 Plantation Ave
- 203 Lynn Ln