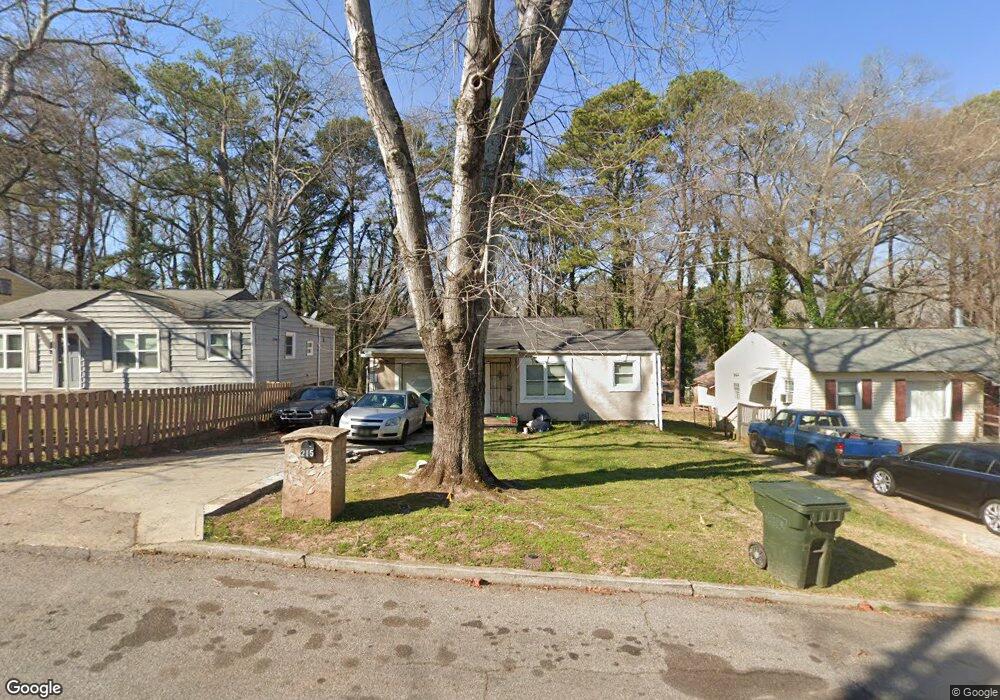
215 Maple St Atlanta, GA 30354
Estimated Value: $208,324 - $227,000
2
Beds
1
Bath
1,017
Sq Ft
$214/Sq Ft
Est. Value
About This Home
This home is located at 215 Maple St, Atlanta, GA 30354 and is currently estimated at $217,331, approximately $213 per square foot. 215 Maple St is a home located in Fulton County with nearby schools including Hapeville Elementary School, Paul D. West Middle School, and Tri-Cities High School.
Ownership History
Date
Name
Owned For
Owner Type
Purchase Details
Closed on
Nov 13, 2006
Sold by
Simpson Blanchetter R
Bought by
Grant Joel
Current Estimated Value
Home Financials for this Owner
Home Financials are based on the most recent Mortgage that was taken out on this home.
Original Mortgage
$184,000
Outstanding Balance
$117,046
Interest Rate
7.59%
Mortgage Type
New Conventional
Estimated Equity
$100,285
Purchase Details
Closed on
Apr 30, 1998
Sold by
Crawford Howard
Bought by
Mangum Jason R
Purchase Details
Closed on
Sep 17, 1994
Sold by
Post Josephine T
Bought by
Vine City Housing Ministry Inc
Create a Home Valuation Report for This Property
The Home Valuation Report is an in-depth analysis detailing your home's value as well as a comparison with similar homes in the area
Home Values in the Area
Average Home Value in this Area
Purchase History
| Date | Buyer | Sale Price | Title Company |
|---|---|---|---|
| Grant Joel | $230,000 | -- | |
| Mangum Jason R | $22,500 | -- | |
| Vine City Housing Ministry Inc | $3,100 | -- |
Source: Public Records
Mortgage History
| Date | Status | Borrower | Loan Amount |
|---|---|---|---|
| Open | Grant Joel | $184,000 |
Source: Public Records
Tax History Compared to Growth
Tax History
| Year | Tax Paid | Tax Assessment Tax Assessment Total Assessment is a certain percentage of the fair market value that is determined by local assessors to be the total taxable value of land and additions on the property. | Land | Improvement |
|---|---|---|---|---|
| 2025 | $1,256 | $64,240 | $19,360 | $44,880 |
| 2023 | $2,026 | $71,760 | $23,680 | $48,080 |
| 2022 | $1,686 | $64,080 | $30,200 | $33,880 |
| 2021 | $742 | $47,160 | $19,920 | $27,240 |
| 2020 | $1,813 | $41,400 | $16,880 | $24,520 |
| 2019 | $622 | $38,600 | $6,680 | $31,920 |
| 2018 | $1,064 | $37,680 | $6,520 | $31,160 |
| 2017 | $463 | $15,880 | $4,840 | $11,040 |
| 2016 | $463 | $15,880 | $4,840 | $11,040 |
| 2015 | $729 | $15,880 | $4,840 | $11,040 |
| 2014 | $487 | $15,880 | $4,840 | $11,040 |
Source: Public Records
Map
Nearby Homes