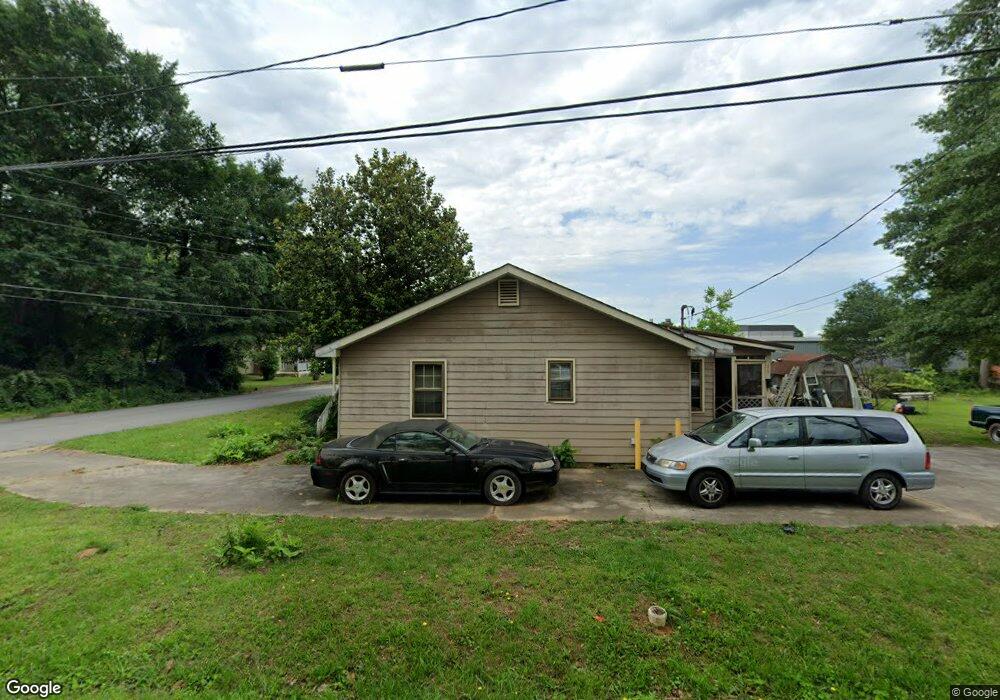
215 Mara St Carrollton, GA 30117
Estimated Value: $168,000 - $210,000
3
Beds
2
Baths
1,449
Sq Ft
$132/Sq Ft
Est. Value
About This Home
This home is located at 215 Mara St, Carrollton, GA 30117 and is currently estimated at $191,870, approximately $132 per square foot. 215 Mara St is a home located in Carroll County with nearby schools including Carrollton Elementary School, Carrollton Upper Elementary School, and Carrollton Middle School.
Ownership History
Date
Name
Owned For
Owner Type
Purchase Details
Closed on
Apr 19, 2011
Sold by
Prime Asset Fund Iii Llc
Bought by
Mcintosh Properties Llc
Current Estimated Value
Purchase Details
Closed on
Jun 15, 2001
Sold by
Holland Johnny
Bought by
Holland Johnny B
Purchase Details
Closed on
Jun 12, 2001
Sold by
Holland Alice Mae
Bought by
Coverson Ray
Purchase Details
Closed on
Jan 1, 2000
Sold by
Holland Johnny B
Bought by
Holland Alice Mae
Purchase Details
Closed on
Feb 12, 1997
Sold by
Harrison J Etal
Bought by
Holland Johnny
Create a Home Valuation Report for This Property
The Home Valuation Report is an in-depth analysis detailing your home's value as well as a comparison with similar homes in the area
Home Values in the Area
Average Home Value in this Area
Purchase History
| Date | Buyer | Sale Price | Title Company |
|---|---|---|---|
| Mcintosh Properties Llc | $16,000 | -- | |
| Holland Johnny B | -- | -- | |
| Coverson Ray | $10,000 | -- | |
| Holland Alice Mae | -- | -- | |
| Holland Johnny | -- | -- |
Source: Public Records
Tax History Compared to Growth
Tax History
| Year | Tax Paid | Tax Assessment Tax Assessment Total Assessment is a certain percentage of the fair market value that is determined by local assessors to be the total taxable value of land and additions on the property. | Land | Improvement |
|---|---|---|---|---|
| 2024 | $1,018 | $37,242 | $7,008 | $30,234 |
| 2023 | $1,018 | $37,242 | $7,008 | $30,234 |
| 2022 | $1,087 | $37,242 | $4,643 | $32,599 |
| 2021 | $766 | $26,230 | $5,033 | $21,197 |
| 2020 | $766 | $26,230 | $5,033 | $21,197 |
| 2019 | $774 | $26,229 | $3,434 | $22,795 |
| 2018 | $536 | $17,900 | $3,434 | $14,466 |
| 2017 | $539 | $17,900 | $3,434 | $14,466 |
| 2016 | $612 | $23,803 | $3,434 | $20,369 |
| 2015 | $365 | $11,811 | $4,000 | $7,811 |
| 2014 | $366 | $11,811 | $4,000 | $7,811 |
Source: Public Records
Map
Nearby Homes