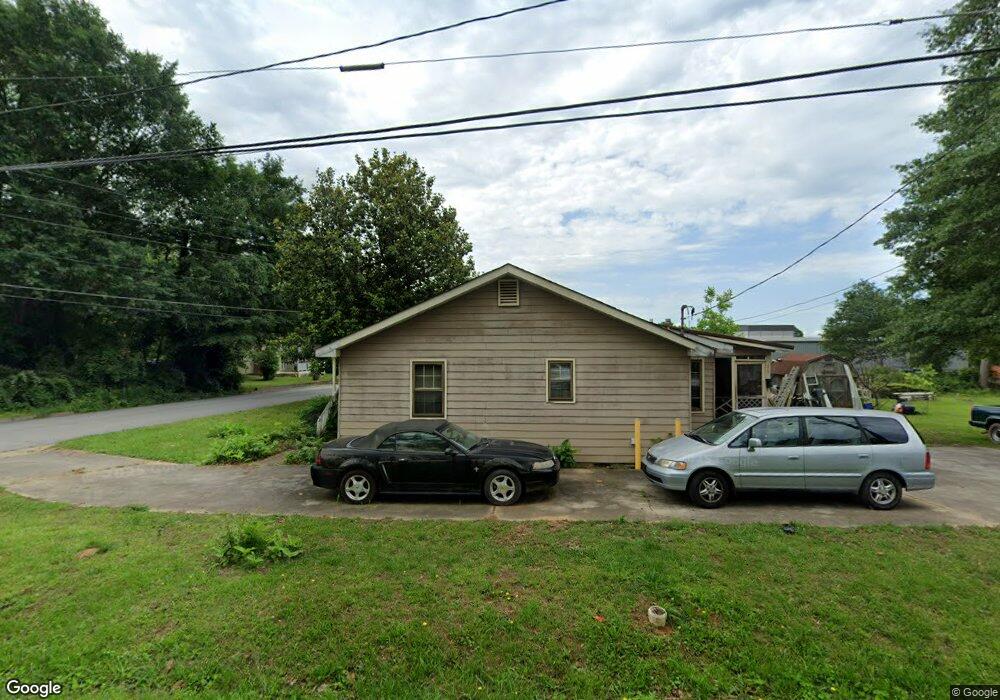
215 Mara St Carrollton, GA 30117
Estimated Value: $192,000 - $411,000
3
Beds
3
Baths
3,954
Sq Ft
$77/Sq Ft
Est. Value
About This Home
This home is located at 215 Mara St, Carrollton, GA 30117 and is currently estimated at $302,667, approximately $76 per square foot. 215 Mara St is a home located in Carroll County with nearby schools including Carrollton Elementary School, Carrollton Upper Elementary School, and Carrollton Middle School.
Ownership History
Date
Name
Owned For
Owner Type
Purchase Details
Closed on
Mar 26, 2014
Sold by
Crimson Whitesburg Llc
Bought by
Wilson Charles J
Current Estimated Value
Purchase Details
Closed on
Dec 10, 2012
Sold by
Synovus Bank
Bought by
Crimson Whitesburg Llc
Purchase Details
Closed on
Dec 4, 2012
Sold by
Thames Deborah L
Bought by
Synvos Bank
Purchase Details
Closed on
Mar 20, 2008
Sold by
Coverson Raymond L
Bought by
Coverson Raymond L and Thames Deborah L
Purchase Details
Closed on
May 6, 2005
Sold by
Carnes Shirley
Bought by
Coverson Raymond L
Home Financials for this Owner
Home Financials are based on the most recent Mortgage that was taken out on this home.
Original Mortgage
$50,000
Interest Rate
5.88%
Mortgage Type
New Conventional
Purchase Details
Closed on
Sep 25, 1997
Sold by
Cook Troy A and Cook Carn S
Bought by
Carnes Shirley
Purchase Details
Closed on
Feb 25, 1994
Bought by
Cook Troy A and Cook Carn S
Create a Home Valuation Report for This Property
The Home Valuation Report is an in-depth analysis detailing your home's value as well as a comparison with similar homes in the area
Home Values in the Area
Average Home Value in this Area
Purchase History
| Date | Buyer | Sale Price | Title Company |
|---|---|---|---|
| Wilson Charles J | $30,000 | -- | |
| Crimson Whitesburg Llc | $23,702 | -- | |
| Synvos Bank | $26,688 | -- | |
| Coverson Raymond L | -- | -- | |
| Coverson Raymond L | $40,000 | -- | |
| Carnes Shirley | -- | -- | |
| Cook Troy A | -- | -- |
Source: Public Records
Mortgage History
| Date | Status | Borrower | Loan Amount |
|---|---|---|---|
| Previous Owner | Coverson Raymond L | $50,000 |
Source: Public Records
Tax History Compared to Growth
Tax History
| Year | Tax Paid | Tax Assessment Tax Assessment Total Assessment is a certain percentage of the fair market value that is determined by local assessors to be the total taxable value of land and additions on the property. | Land | Improvement |
|---|---|---|---|---|
| 2024 | $1,926 | $77,549 | $6,094 | $71,455 |
| 2023 | $2,009 | $69,795 | $4,875 | $64,920 |
| 2022 | $1,572 | $55,288 | $3,250 | $52,038 |
| 2021 | $1,407 | $47,210 | $2,600 | $44,610 |
| 2020 | $1,296 | $42,838 | $2,364 | $40,474 |
| 2019 | $1,222 | $39,623 | $2,364 | $37,259 |
| 2018 | $1,217 | $35,681 | $2,209 | $33,472 |
| 2017 | $1,487 | $43,319 | $2,209 | $41,110 |
| 2016 | $1,487 | $43,319 | $2,209 | $41,110 |
| 2015 | $435 | $29,046 | $8,000 | $21,046 |
| 2014 | $1,055 | $29,046 | $8,000 | $21,046 |
Source: Public Records
Map
Nearby Homes
- 105 Mara St
- 406 Harmon Ave
- 423 Clifton Terrace
- 150 Adamson Dr
- 509 Adamson Ave
- 521 Adamson Ave
- 317 Bledsoe St
- 27 South St
- 114 Bennett Cir
- 214 Lane Dr
- 216 Lane Dr
- 212 Lane Dr Unit LOT 60
- 212 Lane Dr
- 210 Lane Dr Unit LOT 61
- 210 Lane Dr
- 0 Hwy 27 None N
- 202 Laney Dr
- 301 Bradley St
- 112 Lane Dr
- 112 Lane Dr Unit LOT 68