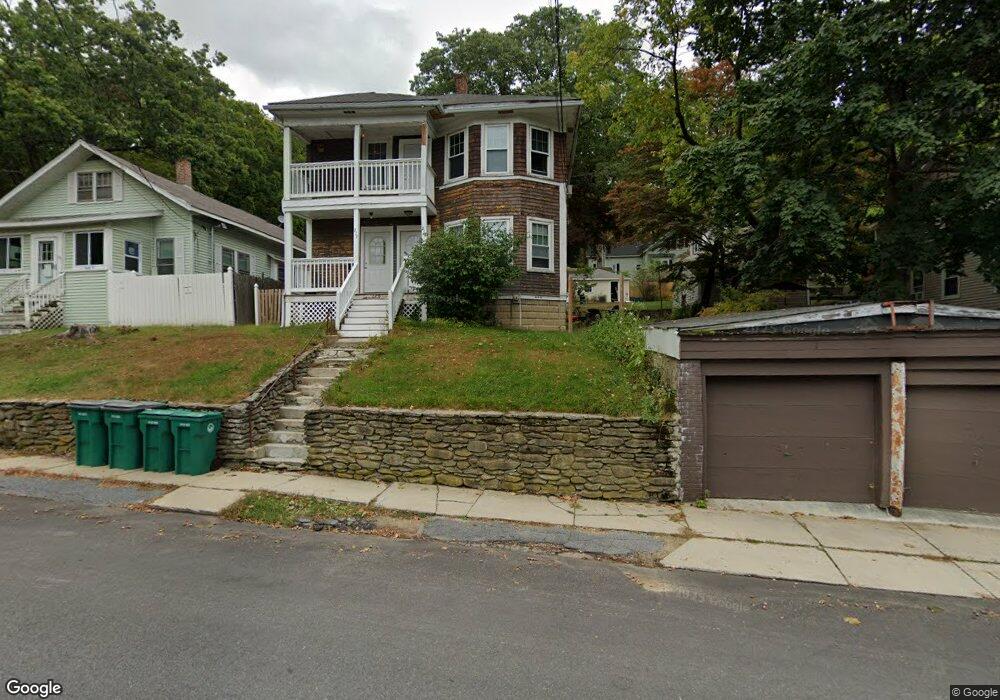
215 Marshall St Unit 2 Fitchburg, MA 01420
Estimated Value: $456,000 - $510,000
2
Beds
1
Bath
1,300
Sq Ft
$371/Sq Ft
Est. Value
About This Home
This home is located at 215 Marshall St Unit 2, Fitchburg, MA 01420 and is currently estimated at $482,009, approximately $370 per square foot. 215 Marshall St Unit 2 is a home located in Worcester County with nearby schools including Crocker Elementary School, Fitchburg High School, and South Street Elementary School.
Ownership History
Date
Name
Owned For
Owner Type
Purchase Details
Closed on
May 11, 2022
Sold by
Colon Jason
Bought by
215-217 Marshall St Rlty
Current Estimated Value
Home Financials for this Owner
Home Financials are based on the most recent Mortgage that was taken out on this home.
Original Mortgage
$300,000
Outstanding Balance
$283,458
Interest Rate
4.67%
Mortgage Type
Stand Alone Refi Refinance Of Original Loan
Estimated Equity
$198,551
Purchase Details
Closed on
Aug 28, 2019
Sold by
Colon Darlene and Colon Jason
Bought by
Colon Jason
Home Financials for this Owner
Home Financials are based on the most recent Mortgage that was taken out on this home.
Original Mortgage
$149,800
Interest Rate
3.7%
Mortgage Type
New Conventional
Purchase Details
Closed on
Dec 21, 1995
Sold by
Shepard Roger P and Shepard Edna H
Bought by
Snyder David A
Home Financials for this Owner
Home Financials are based on the most recent Mortgage that was taken out on this home.
Original Mortgage
$71,932
Interest Rate
7.33%
Mortgage Type
Purchase Money Mortgage
Create a Home Valuation Report for This Property
The Home Valuation Report is an in-depth analysis detailing your home's value as well as a comparison with similar homes in the area
Home Values in the Area
Average Home Value in this Area
Purchase History
| Date | Buyer | Sale Price | Title Company |
|---|---|---|---|
| 215-217 Marshall St Rlty | -- | None Available | |
| 215-217 Marshall St Rlty | -- | None Available | |
| Colon Jason | -- | -- | |
| Snyder David A | $72,000 | -- | |
| Snyder David A | $72,000 | -- |
Source: Public Records
Mortgage History
| Date | Status | Borrower | Loan Amount |
|---|---|---|---|
| Open | 215-217 Marshall St Rlty | $300,000 | |
| Closed | 215-217 Marshall St Rlty | $300,000 | |
| Previous Owner | Colon Jason | $149,800 | |
| Previous Owner | Snyder David A | $105,000 | |
| Previous Owner | Snyder David A | $71,932 |
Source: Public Records
Tax History Compared to Growth
Tax History
| Year | Tax Paid | Tax Assessment Tax Assessment Total Assessment is a certain percentage of the fair market value that is determined by local assessors to be the total taxable value of land and additions on the property. | Land | Improvement |
|---|---|---|---|---|
| 2025 | $53 | $394,100 | $97,200 | $296,900 |
| 2024 | $4,991 | $337,000 | $59,400 | $277,600 |
| 2023 | $4,631 | $289,100 | $51,100 | $238,000 |
| 2022 | $4,214 | $239,300 | $42,800 | $196,500 |
| 2021 | $3,928 | $206,400 | $30,900 | $175,500 |
| 2020 | $3,692 | $187,300 | $28,500 | $158,800 |
| 2019 | $3,217 | $157,000 | $29,700 | $127,300 |
| 2018 | $3,017 | $143,600 | $27,300 | $116,300 |
| 2017 | $2,716 | $126,400 | $25,000 | $101,400 |
| 2016 | $2,683 | $126,400 | $25,000 | $101,400 |
| 2015 | $2,597 | $125,600 | $26,200 | $99,400 |
| 2014 | -- | $125,600 | $26,200 | $99,400 |
Source: Public Records
Map
Nearby Homes
- 218 Marshall St
- 468 Elm St Unit 3
- 205-207 High St
- 202 High St
- 376 Elm St
- 21-23 Omena Place
- 33-35 Omena Place
- 68 Marshall St
- 90 Mechanic St
- 62 Wendell Rd
- 50 Prospect St
- 154 Pleasant St
- 21 Haskell St
- 10 Prospect St
- 39 Arlington St
- 47 Arlington St
- 208 Blossom St
- 59 Arlington St
- 13-15 Chestnut St
- 5 Jay St