Estimated Value: $282,000 - $298,000
3
Beds
2
Baths
1,303
Sq Ft
$223/Sq Ft
Est. Value
About This Home
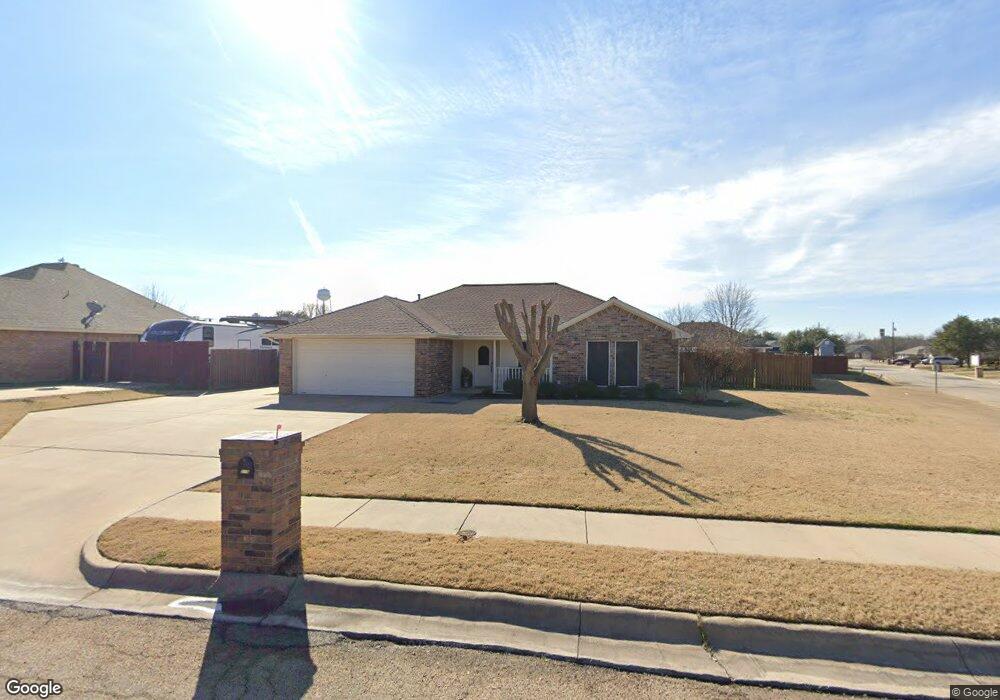
This home is located at 215 Mourning Dove Ln, Krum, TX 76249 and is currently estimated at $291,121, approximately $223 per square foot. 215 Mourning Dove Ln is a home located in Denton County with nearby schools including Krum Early Education Center, Blanche Dodd Intermediate School, and Krum Middle School.
Ownership History
Date
Name
Owned For
Owner Type
Purchase Details
Closed on
Apr 4, 2003
Sold by
Sweeten David B and Sweeten Brenda L
Bought by
Blackburn John W and Blackburn Stacie L
Current Estimated Value
Purchase Details
Closed on
Mar 29, 2000
Sold by
Kisko Deanna L
Bought by
Sweeten David B and Sweeten Brenda L
Home Financials for this Owner
Home Financials are based on the most recent Mortgage that was taken out on this home.
Original Mortgage
$97,450
Interest Rate
8.37%
Purchase Details
Closed on
Nov 1, 1999
Sold by
Edmonds Investment Inc
Bought by
Kisko Deanna L and Tahoe Construction
Home Financials for this Owner
Home Financials are based on the most recent Mortgage that was taken out on this home.
Original Mortgage
$82,650
Interest Rate
7.77%
Mortgage Type
Purchase Money Mortgage
Create a Home Valuation Report for This Property
The Home Valuation Report is an in-depth analysis detailing your home's value as well as a comparison with similar homes in the area
Home Values in the Area
Average Home Value in this Area
Purchase History
| Date | Buyer | Sale Price | Title Company |
|---|---|---|---|
| Blackburn John W | -- | -- | |
| Sweeten David B | -- | -- | |
| Kisko Deanna L | -- | -- |
Source: Public Records
Mortgage History
| Date | Status | Borrower | Loan Amount |
|---|---|---|---|
| Previous Owner | Sweeten David B | $97,450 | |
| Previous Owner | Kisko Deanna L | $82,650 |
Source: Public Records
Tax History Compared to Growth
Tax History
| Year | Tax Paid | Tax Assessment Tax Assessment Total Assessment is a certain percentage of the fair market value that is determined by local assessors to be the total taxable value of land and additions on the property. | Land | Improvement |
|---|---|---|---|---|
| 2025 | $3,332 | $284,000 | $75,421 | $208,579 |
| 2024 | $5,606 | $278,179 | $0 | $0 |
| 2023 | $3,184 | $252,890 | $70,282 | $205,718 |
| 2022 | $5,273 | $229,900 | $75,421 | $173,579 |
| 2021 | $4,635 | $210,000 | $56,276 | $153,724 |
| 2020 | $4,303 | $190,000 | $56,276 | $133,724 |
| 2019 | $4,204 | $174,228 | $56,276 | $128,724 |
| 2018 | $3,841 | $158,389 | $46,413 | $118,587 |
| 2017 | $3,507 | $143,990 | $32,837 | $112,163 |
| 2016 | $3,107 | $130,900 | $32,837 | $120,213 |
| 2015 | $2,696 | $119,000 | $32,837 | $86,163 |
| 2014 | $2,696 | $119,000 | $32,837 | $86,163 |
| 2013 | -- | $116,918 | $32,837 | $84,081 |
Source: Public Records
Map
Nearby Homes
- 213 Mourning Dove Ln
- 216 Dove Meadows
- 218 Dove Meadows
- 214 Dove Meadows
- 113 N Point Dr
- 211 Mourning Dove Ln
- 115 N Point Dr
- 111 N Point Dr
- 212 Mourning Dove Ln
- 212 Dove Meadows
- 117 N Point Dr
- 109 N Point Dr
- 210 Mourning Dove Ln
- 209 Mourning Dove Ln
- 210 Dove Meadows
- 119 N Point Dr
- 107 N Point Dr
- 217 Dove Meadows
- 208 Mourning Dove Ln
- 219 Dove Meadows