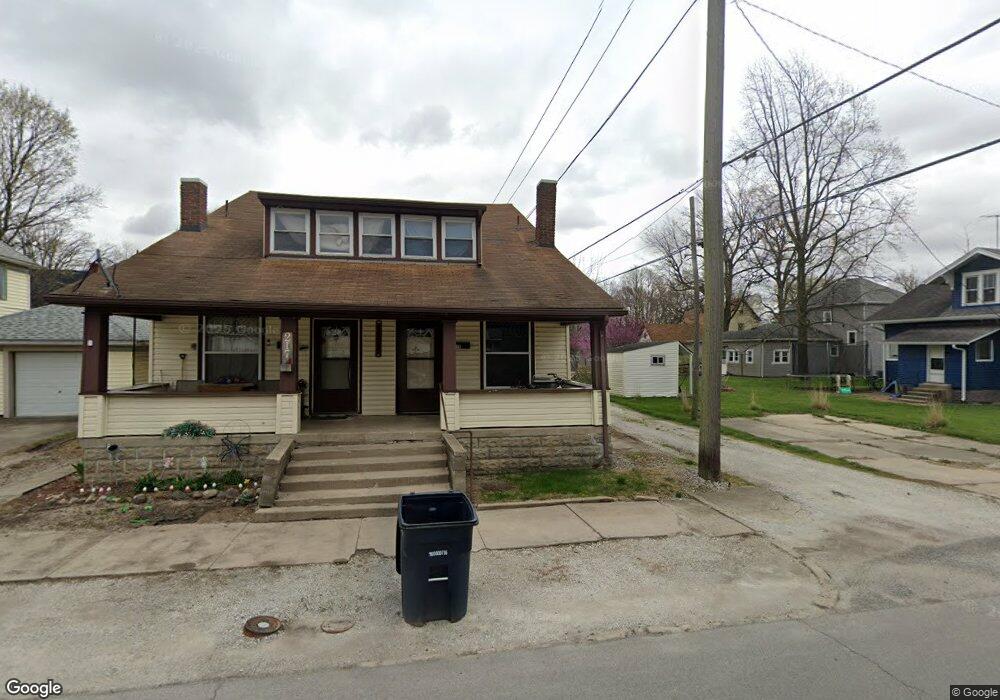
215 N 19th St Elwood, IN 46036
Estimated Value: $114,051 - $164,000
2
Beds
1
Bath
1,520
Sq Ft
$89/Sq Ft
Est. Value
About This Home
This home is located at 215 N 19th St, Elwood, IN 46036 and is currently estimated at $135,513, approximately $89 per square foot. 215 N 19th St is a home located in Madison County with nearby schools including Elwood Elementary School, Elwood Intermediate School, and Elwood Junior-Senior High School.
Ownership History
Date
Name
Owned For
Owner Type
Purchase Details
Closed on
Apr 29, 2022
Sold by
Sides Stephen M
Bought by
Sides Enterprises Llc
Current Estimated Value
Purchase Details
Closed on
Mar 4, 2019
Sold by
Kothe Realty Enterprises Llc
Bought by
Sides Stephens M
Purchase Details
Closed on
Dec 15, 2016
Sold by
Kothe William H
Bought by
Kothe Realty Enterprises Llc
Purchase Details
Closed on
Jan 16, 2015
Sold by
Madison County Sheriff
Bought by
Fifth Third Bank
Create a Home Valuation Report for This Property
The Home Valuation Report is an in-depth analysis detailing your home's value as well as a comparison with similar homes in the area
Home Values in the Area
Average Home Value in this Area
Purchase History
| Date | Buyer | Sale Price | Title Company |
|---|---|---|---|
| Sides Enterprises Llc | -- | None Listed On Document | |
| Sides Stephens M | -- | None Available | |
| Kothe Realty Enterprises Llc | -- | -- | |
| Fifth Third Bank | -- | -- |
Source: Public Records
Tax History Compared to Growth
Tax History
| Year | Tax Paid | Tax Assessment Tax Assessment Total Assessment is a certain percentage of the fair market value that is determined by local assessors to be the total taxable value of land and additions on the property. | Land | Improvement |
|---|---|---|---|---|
| 2025 | $1,496 | $74,800 | $5,100 | $69,700 |
| 2024 | $1,496 | $74,800 | $5,100 | $69,700 |
| 2023 | $1,360 | $68,000 | $4,800 | $63,200 |
| 2022 | $1,364 | $67,700 | $4,500 | $63,200 |
| 2021 | $1,212 | $60,600 | $4,400 | $56,200 |
| 2020 | $1,128 | $55,900 | $4,100 | $51,800 |
| 2019 | $1,098 | $54,400 | $4,100 | $50,300 |
| 2018 | $1,036 | $51,300 | $4,100 | $47,200 |
| 2017 | $1,020 | $51,000 | $4,100 | $46,900 |
| 2016 | $1,040 | $72,000 | $4,000 | $68,000 |
| 2014 | $1,476 | $73,800 | $4,100 | $69,700 |
| 2013 | $1,476 | $73,800 | $4,100 | $69,700 |
Source: Public Records
Map
Nearby Homes