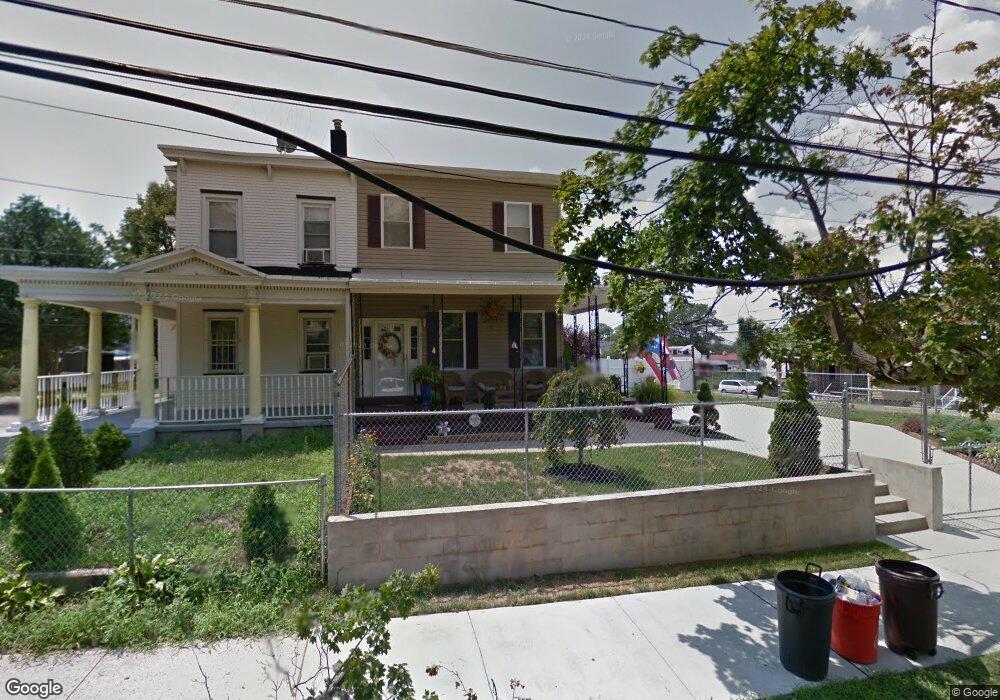
215 N 28th St Camden, NJ 08105
Dudley NeighborhoodEstimated Value: $163,000 - $218,000
--
Bed
--
Bath
1,782
Sq Ft
$108/Sq Ft
Est. Value
About This Home
This home is located at 215 N 28th St, Camden, NJ 08105 and is currently estimated at $193,094, approximately $108 per square foot. 215 N 28th St is a home located in Camden County with nearby schools including Catto Community School, Eastside High School, and St Joseph Pro-Cathedral School.
Ownership History
Date
Name
Owned For
Owner Type
Purchase Details
Closed on
Jul 19, 2023
Sold by
Rivera Emma G
Bought by
Vega-Rodriguez Juan
Current Estimated Value
Home Financials for this Owner
Home Financials are based on the most recent Mortgage that was taken out on this home.
Original Mortgage
$135,000
Interest Rate
7.12%
Mortgage Type
New Conventional
Purchase Details
Closed on
Nov 24, 2008
Sold by
Saint Josephs Carpenter Society
Bought by
Rivera Emma G
Home Financials for this Owner
Home Financials are based on the most recent Mortgage that was taken out on this home.
Original Mortgage
$91,100
Interest Rate
6.49%
Mortgage Type
Unknown
Purchase Details
Closed on
Jun 2, 2000
Sold by
Estate Of Robert W Joyner
Bought by
Ramos Jonathan and Ramos Carmen I
Home Financials for this Owner
Home Financials are based on the most recent Mortgage that was taken out on this home.
Original Mortgage
$58,641
Interest Rate
8.12%
Create a Home Valuation Report for This Property
The Home Valuation Report is an in-depth analysis detailing your home's value as well as a comparison with similar homes in the area
Home Values in the Area
Average Home Value in this Area
Purchase History
| Date | Buyer | Sale Price | Title Company |
|---|---|---|---|
| Vega-Rodriguez Juan | $150,000 | None Listed On Document | |
| Rivera Emma G | $100,000 | -- | |
| Ramos Jonathan | $55,000 | -- |
Source: Public Records
Mortgage History
| Date | Status | Borrower | Loan Amount |
|---|---|---|---|
| Previous Owner | Vega-Rodriguez Juan | $135,000 | |
| Previous Owner | Rivera Emma G | $91,100 | |
| Previous Owner | Ramos Jonathan | $58,641 |
Source: Public Records
Tax History Compared to Growth
Tax History
| Year | Tax Paid | Tax Assessment Tax Assessment Total Assessment is a certain percentage of the fair market value that is determined by local assessors to be the total taxable value of land and additions on the property. | Land | Improvement |
|---|---|---|---|---|
| 2025 | $3,756 | $106,000 | $31,800 | $74,200 |
| 2024 | $3,631 | $106,000 | $31,800 | $74,200 |
| 2023 | $3,631 | $106,000 | $31,800 | $74,200 |
| 2022 | $3,563 | $106,000 | $31,800 | $74,200 |
| 2021 | $3,550 | $106,000 | $31,800 | $74,200 |
| 2020 | $3,371 | $106,000 | $31,800 | $74,200 |
| 2019 | $3,228 | $106,000 | $31,800 | $74,200 |
| 2018 | $3,211 | $106,000 | $31,800 | $74,200 |
| 2017 | $3,132 | $106,000 | $31,800 | $74,200 |
| 2016 | $3,033 | $106,000 | $31,800 | $74,200 |
| 2015 | $2,919 | $106,000 | $31,800 | $74,200 |
| 2014 | $2,849 | $106,000 | $31,800 | $74,200 |
Source: Public Records
Map
Nearby Homes
- 100 E 28th St
- 2709 Westfield Ave
- 2817 Westfield Ave
- 2707 Westfield Ave
- 403 N 29th St
- 2621 Westfield Ave
- 2934 Cramer St
- 3027 Morrison St
- 2817 Thompson St
- 32 N 25th St
- 41 N 24th St
- 2598 Baird Blvd
- 127 N 23rd St
- 2937 Carman St
- 154 Eutaw Ave
- 2112 Howell St
- 2816 Pleasant St
- 2818 Cleveland Ave
- 2830 Cleveland Ave
- 3170 Merriel Ave
- 213 N 28th St
- 2720 Saunders St
- 2727 High St
- 2747 Saunders St
- 2749 Saunders St
- 2745 Saunders St
- 2751 Saunders St
- 2743 Saunders St
- 2753 Saunders St
- 2741 Saunders St
- 2725 High St
- 2714 Saunders St
- 201 N 28th St
- 2719 High St
- 212 N 28th St
- 310 N 28th St
- 210 N 28th St
- 2717 High St
- 2715 High St
- 2725 Saunders St