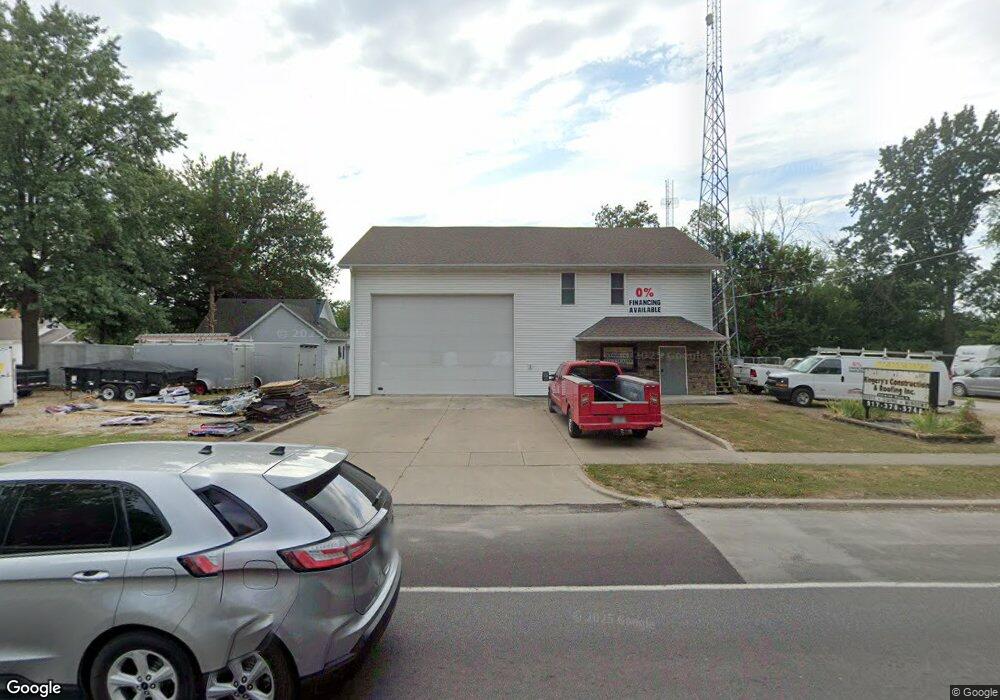
215 N 3rd St Girard, IL 62640
Estimated Value: $144,674
--
Bed
--
Bath
--
Sq Ft
0.25
Acres
About This Home
This home is located at 215 N 3rd St, Girard, IL 62640 and is currently estimated at $144,674. 215 N 3rd St is a home located in Macoupin County with nearby schools including North Mac Intermediate School, North Mac Middle School, and North Mac High School.
Ownership History
Date
Name
Owned For
Owner Type
Purchase Details
Closed on
Dec 16, 2019
Sold by
Medical Response Holdings Llc
Bought by
Kingerys Properties Llc
Current Estimated Value
Home Financials for this Owner
Home Financials are based on the most recent Mortgage that was taken out on this home.
Original Mortgage
$94,690
Outstanding Balance
$85,964
Interest Rate
5.25%
Mortgage Type
New Conventional
Estimated Equity
$58,710
Purchase Details
Closed on
Mar 5, 2015
Sold by
Reznicek Thomas E
Bought by
Medical Response Holdings Llc
Home Financials for this Owner
Home Financials are based on the most recent Mortgage that was taken out on this home.
Original Mortgage
$83,725
Interest Rate
4.3%
Mortgage Type
Commercial
Purchase Details
Closed on
Nov 9, 2013
Sold by
Reznicek Donna M
Bought by
Reznicek Thomas E
Purchase Details
Closed on
Feb 8, 2000
Bought by
Reznicek Thomas
Create a Home Valuation Report for This Property
The Home Valuation Report is an in-depth analysis detailing your home's value as well as a comparison with similar homes in the area
Home Values in the Area
Average Home Value in this Area
Purchase History
| Date | Buyer | Sale Price | Title Company |
|---|---|---|---|
| Kingerys Properties Llc | $95,000 | None Available | |
| Medical Response Holdings Llc | $98,500 | Community Title & Escrow | |
| Reznicek Thomas E | -- | -- | |
| Reznicek Thomas | $70,000 | -- |
Source: Public Records
Mortgage History
| Date | Status | Borrower | Loan Amount |
|---|---|---|---|
| Open | Kingerys Properties Llc | $94,690 | |
| Previous Owner | Medical Response Holdings Llc | $83,725 |
Source: Public Records
Tax History Compared to Growth
Tax History
| Year | Tax Paid | Tax Assessment Tax Assessment Total Assessment is a certain percentage of the fair market value that is determined by local assessors to be the total taxable value of land and additions on the property. | Land | Improvement |
|---|---|---|---|---|
| 2024 | $3,334 | $39,665 | $8,160 | $31,505 |
| 2023 | $3,216 | $36,727 | $7,556 | $29,171 |
| 2022 | $3,192 | $34,325 | $7,062 | $27,263 |
| 2021 | $2,958 | $32,079 | $6,600 | $25,479 |
| 2020 | $2,871 | $32,079 | $6,600 | $25,479 |
| 2019 | $2,837 | $32,079 | $6,600 | $25,479 |
| 2018 | $2,731 | $32,079 | $6,600 | $25,479 |
| 2017 | $2,544 | $32,079 | $6,600 | $25,479 |
| 2016 | $2,744 | $32,079 | $6,600 | $25,479 |
| 2015 | $2,622 | $32,079 | $6,600 | $25,479 |
| 2014 | $2,577 | $32,079 | $6,600 | $25,479 |
| 2013 | $2,591 | $32,906 | $7,427 | $25,479 |
Source: Public Records
Map
Nearby Homes
- 403 S 4th St
- Lot 7 4th St
- 214 S Sherman St
- 1030 W Center St
- 801 S 5th St
- 215 N Wilson St
- 112 N Wilson St
- 32312 Pleasant Hill Rd
- 18658 Blackhawk Dr
- 115 W Loud St
- 222 S Wrightsman St
- 15932 Spruce Ln
- 710 W Dean St
- 700 W Dean St
- Lots 8-10 W Dean St
- 59 Morean St
- Lots 13-16 Short St
- 114 S Blair St
- Lots 1-4 Jackson St
- 120 N Henderson St
- 195 N 3rd St
- 304 W Jefferson St
- 308 W Jefferson St
- 219 N 3rd St
- 316 W Jefferson St
- 318 W Jefferson St
- 119 N 3rd St
- 214 W Jefferson St
- 218 N 3rd St
- 227 N 3rd St
- 315 W Jefferson St
- 118 N 3rd St
- 218 N 4th St
- 315 W Washington St
- 215 W Jefferson St
- 116 N 4th St
- 208 W Jefferson St
- 228 N 4th St
- 205 N 4th St
- 109 N 3rd St