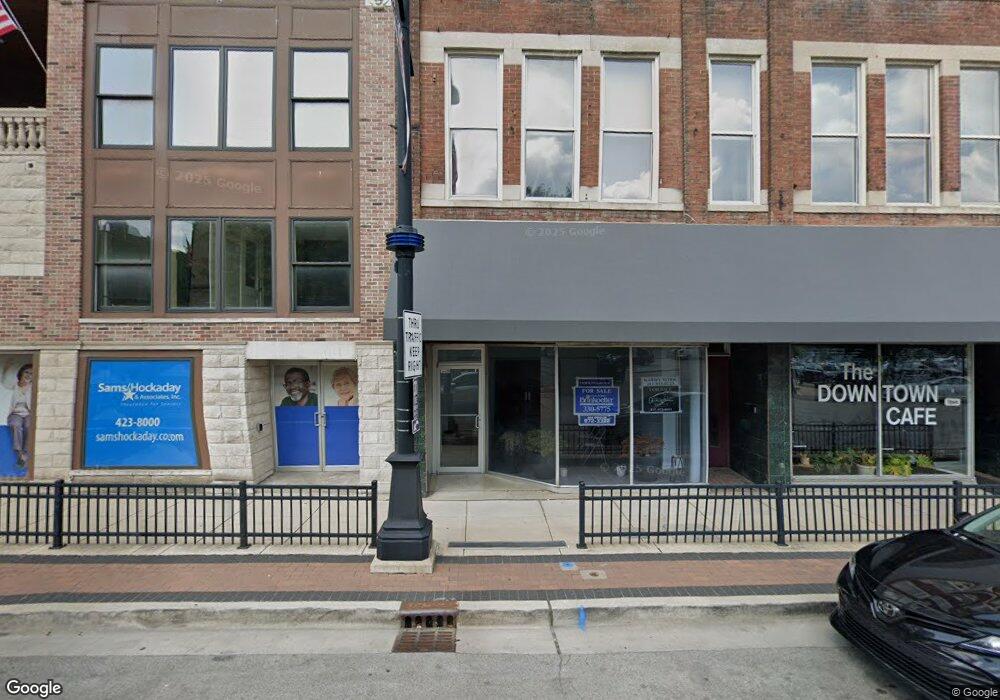
215 N Main St Decatur, IL 62523
Millikin Home NeighborhoodEstimated Value: $235,102
Studio
--
Bath
--
Sq Ft
3,049
Sq Ft Lot
About This Home
This home is located at 215 N Main St, Decatur, IL 62523 and is currently priced at $235,102. 215 N Main St is a home located in Macon County with nearby schools including Dennis Lab School, St. Patrick School, and Teen Challenge-Home For Girls.
Ownership History
Date
Name
Owned For
Owner Type
Purchase Details
Closed on
Aug 18, 2022
Sold by
Markwell Sherry L
Bought by
Chandler Brian
Current Estimated Value
Home Financials for this Owner
Home Financials are based on the most recent Mortgage that was taken out on this home.
Original Mortgage
$88,000
Outstanding Balance
$36,508
Interest Rate
5.3%
Mortgage Type
New Conventional
Purchase Details
Closed on
Jun 30, 2022
Sold by
Boedeker Mr Paul C
Bought by
Markwell Mrs Sherry L
Home Financials for this Owner
Home Financials are based on the most recent Mortgage that was taken out on this home.
Original Mortgage
$88,000
Outstanding Balance
$36,508
Interest Rate
5.3%
Mortgage Type
New Conventional
Create a Home Valuation Report for This Property
The Home Valuation Report is an in-depth analysis detailing your home's value as well as a comparison with similar homes in the area
Home Values in the Area
Average Home Value in this Area
Purchase History
| Date | Buyer | Sale Price | Title Company |
|---|---|---|---|
| Chandler Brian | $110,000 | -- | |
| Markwell Mrs Sherry L | -- | -- |
Source: Public Records
Mortgage History
| Date | Status | Borrower | Loan Amount |
|---|---|---|---|
| Open | Chandler Brian | $88,000 |
Source: Public Records
Tax History
| Year | Tax Paid | Tax Assessment Tax Assessment Total Assessment is a certain percentage of the fair market value that is determined by local assessors to be the total taxable value of land and additions on the property. | Land | Improvement |
|---|---|---|---|---|
| 2024 | $3,864 | $39,916 | $4,204 | $35,712 |
| 2023 | $3,832 | $38,503 | $4,055 | $34,448 |
| 2022 | $3,644 | $35,628 | $3,752 | $31,876 |
| 2021 | $3,424 | $33,273 | $3,504 | $29,769 |
| 2020 | $3,374 | $31,729 | $3,342 | $28,387 |
| 2019 | $3,374 | $31,729 | $3,342 | $28,387 |
| 2018 | $2,593 | $24,682 | $2,941 | $21,741 |
| 2017 | $2,654 | $25,341 | $3,020 | $22,321 |
| 2016 | $2,705 | $25,600 | $3,051 | $22,549 |
| 2015 | $2,570 | $25,147 | $2,997 | $22,150 |
| 2014 | $2,387 | $24,898 | $2,967 | $21,931 |
| 2013 | $2,466 | $25,833 | $3,078 | $22,755 |
Source: Public Records
Map
Nearby Homes
- 281 W Prairie Ave
- 330 W William St
- 366 W Prairie Ave
- 233 N Edward St
- 442 W Prairie Ave
- 233 S Edward St
- 314 W Decatur St
- 555 W Main St
- 357 W Decatur St
- 609 W William St
- 428 Powers Ln
- 717 W Prairie Ave Unit 2
- 657 W Wood St
- 254 N Pine St
- 128 N Hilton St
- 602 E Decatur St
- 612 S Jackson St
- 899 W Main St
- 958 W William St
- 1005 W Main St
- 201 N Main St
- 219 N Main St
- 201 N Main St
- 217 N Main St
- 235 N Main St Unit 6 E
- 114 W Prairie Ave
- 231 N Main St Unit 3
- 231 N Main St
- 104 E Prairie Ave
- 237 N Main St
- 237 N Main St Unit C-1
- 116 E Prairie Ave
- 241 N Main St
- 249 N Main St
- 253 N Main St
- 145 N Merchant St Condo #2
- 145 N Merchant St
- 145 N Merchant St Condo 1 2nd Floor
- 124 E Prairie Ave
- 101 E Prairie Ave
Your Personal Tour Guide
Ask me questions while you tour the home.