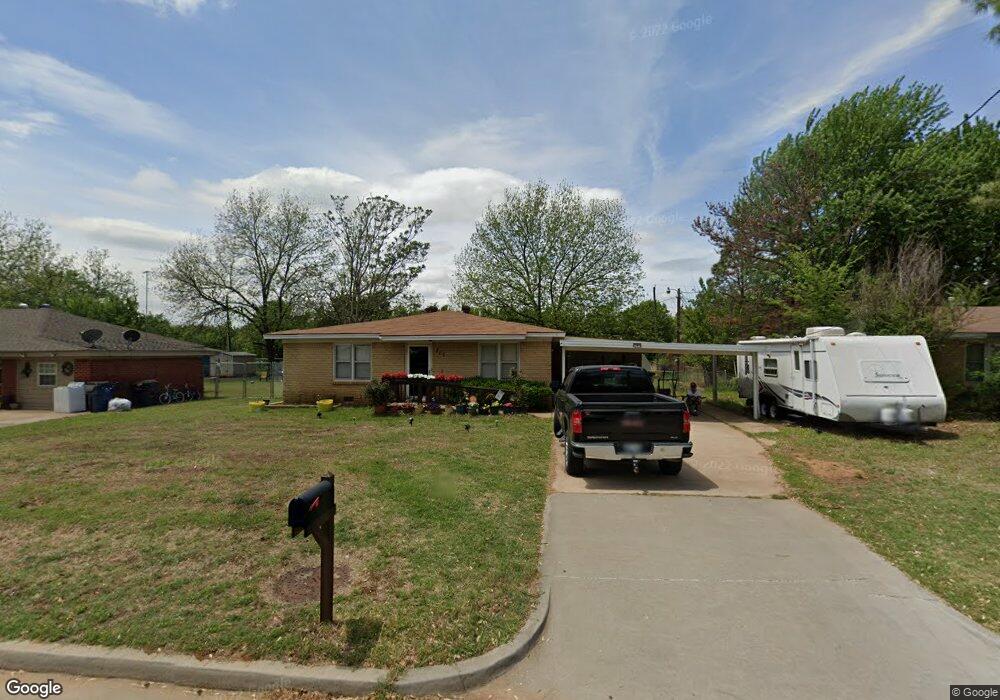
215 N N St Duncan, OK 73533
Estimated Value: $102,661 - $127,000
3
Beds
1
Bath
1,328
Sq Ft
$86/Sq Ft
Est. Value
About This Home
This home is located at 215 N N St, Duncan, OK 73533 and is currently estimated at $114,665, approximately $86 per square foot. 215 N N St is a home located in Stephens County with nearby schools including Woodrow Wilson Elementary School, Duncan Middle School, and Duncan High School.
Ownership History
Date
Name
Owned For
Owner Type
Purchase Details
Closed on
Jan 8, 2016
Sold by
Johnson Rental Inc
Bought by
Hughes Carl and Hughes Agnes
Current Estimated Value
Purchase Details
Closed on
Oct 8, 2013
Sold by
Hammond Jessie
Bought by
Johnson Rental Inc
Purchase Details
Closed on
Feb 12, 2010
Sold by
Holand Tommy L
Bought by
Hammond Jessie
Purchase Details
Closed on
Jan 12, 2010
Sold by
Holland Tommy L
Bought by
Hammond Jessie
Purchase Details
Closed on
Mar 13, 2006
Sold by
Holland Betty Lou
Bought by
Holland Betty Lou and Holland Telvis Eldridge
Purchase Details
Closed on
Aug 22, 1997
Sold by
Holland Tommy
Create a Home Valuation Report for This Property
The Home Valuation Report is an in-depth analysis detailing your home's value as well as a comparison with similar homes in the area
Home Values in the Area
Average Home Value in this Area
Purchase History
| Date | Buyer | Sale Price | Title Company |
|---|---|---|---|
| Hughes Carl | $63,000 | None Available | |
| Johnson Rental Inc | $19,000 | None Available | |
| Hammond Jessie | $25,000 | None Available | |
| Hammond Jessie | $50,000 | None Available | |
| Holland Betty Lou | -- | None Available | |
| -- | -- | -- |
Source: Public Records
Tax History Compared to Growth
Tax History
| Year | Tax Paid | Tax Assessment Tax Assessment Total Assessment is a certain percentage of the fair market value that is determined by local assessors to be the total taxable value of land and additions on the property. | Land | Improvement |
|---|---|---|---|---|
| 2025 | $728 | $8,625 | $111 | $8,514 |
| 2024 | $700 | $8,214 | $111 | $8,103 |
| 2023 | $700 | $7,823 | $111 | $7,712 |
| 2022 | $637 | $7,862 | $367 | $7,495 |
| 2021 | $607 | $7,130 | $83 | $7,047 |
| 2020 | $609 | $7,048 | $83 | $6,965 |
| 2019 | $613 | $7,081 | $330 | $6,751 |
| 2018 | $626 | $7,024 | $83 | $6,941 |
| 2017 | $604 | $7,026 | $83 | $6,943 |
| 2016 | $183 | $2,153 | $495 | $1,658 |
| 2015 | $349 | $2,153 | $495 | $1,658 |
| 2014 | $349 | $2,153 | $495 | $1,658 |
Source: Public Records
Map
Nearby Homes