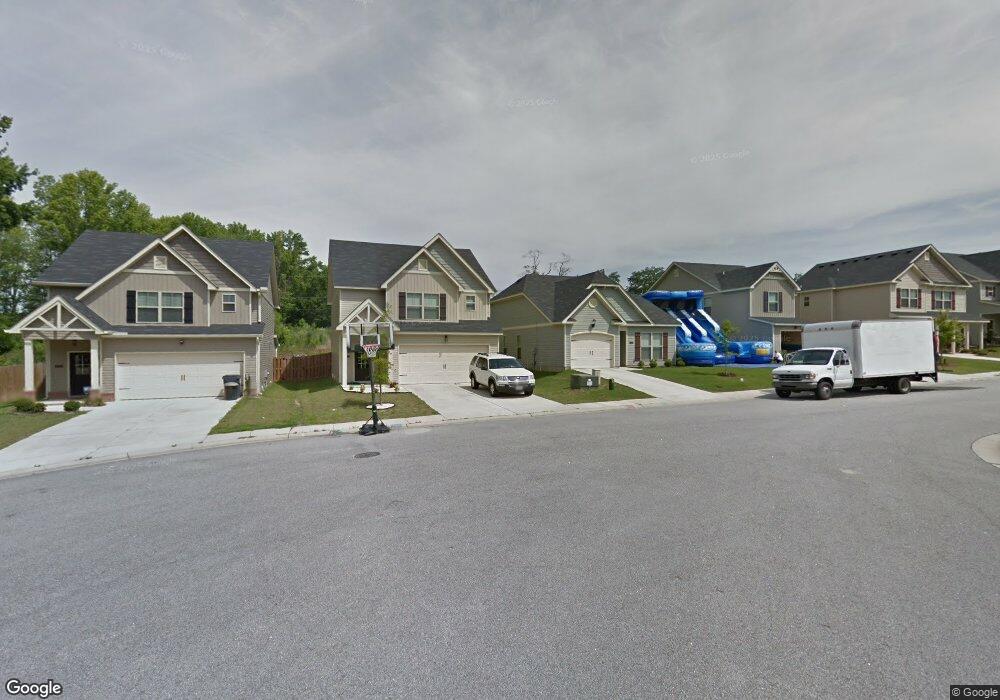
215 Old Berzelia Rd Grovetown, GA 30813
Estimated Value: $322,000 - $392,792
3
Beds
3
Baths
2,180
Sq Ft
$164/Sq Ft
Est. Value
About This Home
This home is located at 215 Old Berzelia Rd, Grovetown, GA 30813 and is currently estimated at $357,396, approximately $163 per square foot. 215 Old Berzelia Rd is a home located in Columbia County with nearby schools including Cedar Ridge Elementary School, Grovetown Middle School, and Grovetown High School.
Ownership History
Date
Name
Owned For
Owner Type
Purchase Details
Closed on
Jun 30, 2022
Sold by
Pittman Wanda M
Bought by
Stanley Martin Homes Llc
Current Estimated Value
Purchase Details
Closed on
Nov 17, 2011
Sold by
Milby James F
Bought by
Pittman Wanda F
Home Financials for this Owner
Home Financials are based on the most recent Mortgage that was taken out on this home.
Original Mortgage
$216,372
Interest Rate
3.75%
Mortgage Type
FHA
Purchase Details
Closed on
Jun 29, 2006
Sold by
Mcdaniel Elsie Marie
Bought by
Milby James F
Home Financials for this Owner
Home Financials are based on the most recent Mortgage that was taken out on this home.
Original Mortgage
$215,100
Interest Rate
6.6%
Mortgage Type
New Conventional
Purchase Details
Closed on
Dec 1, 2004
Sold by
Mcdaniel Jefferson Scott and Mcdaniel George Clayton
Bought by
Mcdaniel Elsie Marie
Create a Home Valuation Report for This Property
The Home Valuation Report is an in-depth analysis detailing your home's value as well as a comparison with similar homes in the area
Home Values in the Area
Average Home Value in this Area
Purchase History
| Date | Buyer | Sale Price | Title Company |
|---|---|---|---|
| Stanley Martin Homes Llc | -- | -- | |
| Stanley Martin Homes Llc | $375,000 | -- | |
| Pittman Wanda F | $222,000 | -- | |
| Milby James F | $239,000 | -- | |
| Mcdaniel Elsie Marie | -- | -- |
Source: Public Records
Mortgage History
| Date | Status | Borrower | Loan Amount |
|---|---|---|---|
| Previous Owner | Pittman Wanda F | $216,372 | |
| Previous Owner | Milby James F | $215,100 |
Source: Public Records
Tax History Compared to Growth
Tax History
| Year | Tax Paid | Tax Assessment Tax Assessment Total Assessment is a certain percentage of the fair market value that is determined by local assessors to be the total taxable value of land and additions on the property. | Land | Improvement |
|---|---|---|---|---|
| 2024 | $2,048 | $69,428 | $67,558 | $1,870 |
| 2023 | $2,048 | $52,031 | $49,928 | $2,103 |
| 2022 | $2,228 | $72,347 | $40,938 | $31,409 |
| 2021 | $2,142 | $66,560 | $38,979 | $27,581 |
| 2020 | $2,198 | $67,098 | $38,978 | $28,120 |
| 2019 | $3,088 | $93,405 | $38,978 | $54,427 |
| 2018 | $2,997 | $89,194 | $38,978 | $50,216 |
| 2017 | $2,834 | $86,937 | $38,978 | $47,959 |
| 2016 | $2,754 | $86,709 | $38,897 | $47,812 |
| 2015 | $2,745 | $86,044 | $38,897 | $47,147 |
| 2014 | $2,822 | $87,517 | $38,897 | $48,620 |
Source: Public Records
Map
Nearby Homes
- 803 Whispering Willow Ct
- 917 Kay Place
- The Kershaw Plan at Ferguson Farms
- The Jefferson Plan at Ferguson Farms
- 2027 Saylor Ln
- 2030 Saylor Ln
- The Sadler Plan at Ferguson Farms
- The Tyndall Plan at Ferguson Farms
- 3010 Dale St
- 3008 Dale St
- 2028 Saylor Ln
- The Hollins Plan at Ferguson Farms
- The Lambert Plan at Ferguson Farms
- The Easton Plan at Ferguson Farms
- 3006 Dale St
- 400 Newmantown Rd
- 3014 Dale St
- 3016 Dale St
- 607 Jeremy Ct
- 605 Jeremy Ct Unit 91
- 213 Old Berzelia Rd
- 219 Old Berzelia Rd
- 609 Jeremy Ct
- 609 Jeremy Ct Unit 89
- 223 Old Berzelia Rd
- 801 Whispering Willow Ct
- 1133 Sierra Ln
- 1132 Sierra Ln
- 227 Old Berzelia Rd
- 1131 Sierra Ln
- 805 Whispering Willow Ct
- 1130 Sierra Ln
- 800 Whispering Willow Ct
- 1129 Sierra Ln
- 807 Whispering Willow Ct
- 802 Whispering Willow Ct
- 1128 Sierra Ln
- 809 Whispering Willow Ct