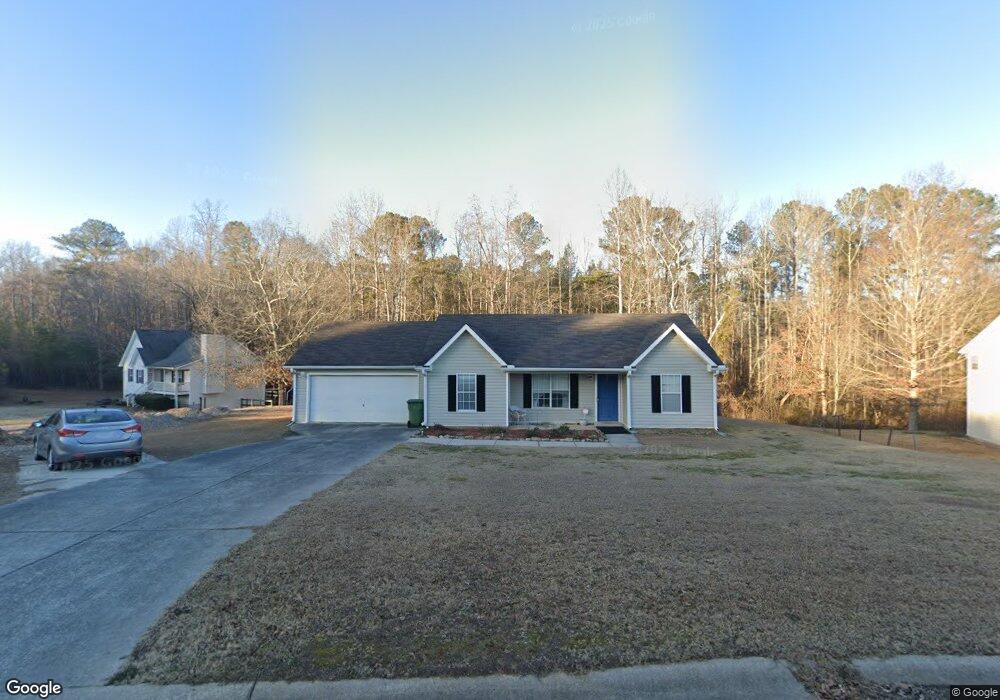
215 Overview Ct Villa Rica, GA 30180
Estimated Value: $241,356 - $262,000
3
Beds
2
Baths
1,112
Sq Ft
$225/Sq Ft
Est. Value
About This Home
This home is located at 215 Overview Ct, Villa Rica, GA 30180 and is currently estimated at $250,589, approximately $225 per square foot. 215 Overview Ct is a home located in Carroll County with nearby schools including Glanton-Hindsman Elementary School, Villa Rica Middle School, and Villa Rica High School.
Ownership History
Date
Name
Owned For
Owner Type
Purchase Details
Closed on
Sep 6, 2013
Sold by
Bradshaw Willis Tom
Bought by
Odonnell Deborah K
Current Estimated Value
Home Financials for this Owner
Home Financials are based on the most recent Mortgage that was taken out on this home.
Original Mortgage
$67,346
Outstanding Balance
$50,236
Interest Rate
4.39%
Mortgage Type
New Conventional
Estimated Equity
$200,353
Purchase Details
Closed on
Mar 24, 2011
Sold by
Schelper Helen W Estate
Bought by
Bradshaw Willis Tom
Purchase Details
Closed on
Dec 20, 2010
Sold by
Bradshaw Willis Tom
Bought by
Bradshaw Willis Tom
Purchase Details
Closed on
Nov 30, 2001
Sold by
Cambridge Home Bldrs
Bought by
Schelper Helen W
Purchase Details
Closed on
May 22, 2001
Sold by
Pinehurst Properties
Bought by
Cambridge Home Bldrs
Purchase Details
Closed on
May 14, 2001
Bought by
Pinehurst Properties
Create a Home Valuation Report for This Property
The Home Valuation Report is an in-depth analysis detailing your home's value as well as a comparison with similar homes in the area
Home Values in the Area
Average Home Value in this Area
Purchase History
| Date | Buyer | Sale Price | Title Company |
|---|---|---|---|
| Odonnell Deborah K | $66,000 | -- | |
| Bradshaw Willis Tom | -- | -- | |
| Bradshaw Willis Tom | -- | -- | |
| Schelper Helen W | $89,400 | -- | |
| Cambridge Home Bldrs | $336,000 | -- | |
| Pinehurst Properties | -- | -- |
Source: Public Records
Mortgage History
| Date | Status | Borrower | Loan Amount |
|---|---|---|---|
| Open | Odonnell Deborah K | $67,346 |
Source: Public Records
Tax History Compared to Growth
Tax History
| Year | Tax Paid | Tax Assessment Tax Assessment Total Assessment is a certain percentage of the fair market value that is determined by local assessors to be the total taxable value of land and additions on the property. | Land | Improvement |
|---|---|---|---|---|
| 2024 | $2,008 | $88,765 | $8,000 | $80,765 |
| 2023 | $2,008 | $81,497 | $8,000 | $73,497 |
| 2022 | $1,680 | $66,980 | $8,000 | $58,980 |
| 2021 | $1,502 | $58,586 | $8,000 | $50,586 |
| 2020 | $1,205 | $46,936 | $8,000 | $38,936 |
| 2019 | $1,128 | $43,582 | $8,000 | $35,582 |
| 2018 | $1,094 | $41,677 | $8,000 | $33,677 |
| 2017 | $1,024 | $38,886 | $8,000 | $30,886 |
| 2016 | $1,025 | $38,886 | $8,000 | $30,886 |
| 2015 | $963 | $34,444 | $8,000 | $26,444 |
| 2014 | $741 | $34,444 | $8,000 | $26,444 |
Source: Public Records
Map
Nearby Homes
- 211 Overview Ct
- 219 Overview Ct
- 214 Overview Ct
- 0 Overview Ct
- 207 Overview Ct
- 218 Overview Ct
- 223 Overview Ct
- 222 Overview Ct
- 203 Overview Ct
- 200 Overview Ct
- 200 Overview Ct Unit 260
- 147 Hunters Lake Dr
- 161 Hunters Lake Dr
- 197 Overview Ct
- 165 Hunters Lake Dr
- 143 Hunters Lake Dr
- 0 Hunters Lake Dr Unit 8724911
- 0 Hunters Lake Dr Unit 8478565
- 0 Hunters Lake Dr Unit 8483525
- 0 Hunters Lake Dr Unit 8448877