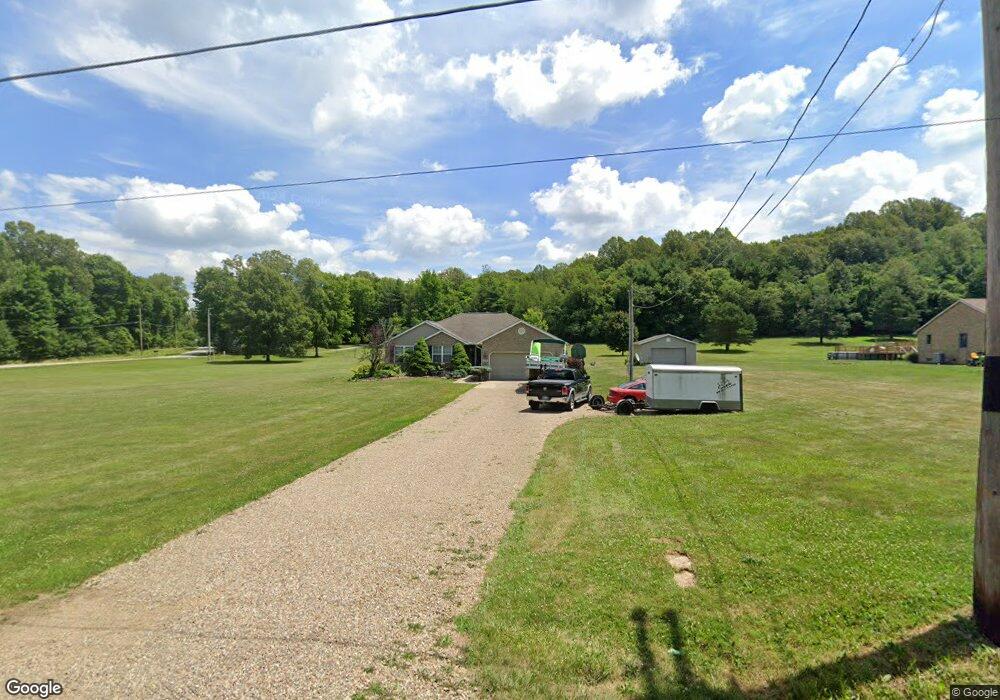
215 Pugh Rd Mansfield, OH 44903
Estimated Value: $299,000 - $327,000
3
Beds
2
Baths
1,762
Sq Ft
$180/Sq Ft
Est. Value
About This Home
This home is located at 215 Pugh Rd, Mansfield, OH 44903 and is currently estimated at $316,713, approximately $179 per square foot. 215 Pugh Rd is a home located in Richland County with nearby schools including Madison High School.
Ownership History
Date
Name
Owned For
Owner Type
Purchase Details
Closed on
Jan 17, 2006
Sold by
Au William
Bought by
Au William and Pucket Hayes Bronwyn Nicole
Current Estimated Value
Home Financials for this Owner
Home Financials are based on the most recent Mortgage that was taken out on this home.
Original Mortgage
$38,700
Interest Rate
6%
Mortgage Type
Stand Alone Second
Purchase Details
Closed on
Dec 14, 2005
Sold by
Jaynes Michael A
Bought by
Au William
Home Financials for this Owner
Home Financials are based on the most recent Mortgage that was taken out on this home.
Original Mortgage
$38,700
Interest Rate
6%
Mortgage Type
Stand Alone Second
Purchase Details
Closed on
Jan 12, 2004
Sold by
Jaynes Kimberly A and Hayes Michael A
Bought by
Hayes Michael A
Purchase Details
Closed on
Nov 27, 2001
Sold by
Ohl Robert H
Bought by
Jaynes Michael A and Jaynes Kimberly A
Purchase Details
Closed on
Dec 16, 1997
Sold by
Malas Ernie S
Bought by
Cyrus Christopher L and Cyrus Rose M R
Create a Home Valuation Report for This Property
The Home Valuation Report is an in-depth analysis detailing your home's value as well as a comparison with similar homes in the area
Home Values in the Area
Average Home Value in this Area
Purchase History
| Date | Buyer | Sale Price | Title Company |
|---|---|---|---|
| Au William | -- | None Available | |
| Au William | $193,500 | Acs Title & Closing | |
| Hayes Michael A | -- | -- | |
| Jaynes Michael A | $20,000 | -- | |
| Cyrus Christopher L | $500 | -- |
Source: Public Records
Mortgage History
| Date | Status | Borrower | Loan Amount |
|---|---|---|---|
| Closed | Au William | $38,700 | |
| Open | Au William | $154,800 |
Source: Public Records
Tax History Compared to Growth
Tax History
| Year | Tax Paid | Tax Assessment Tax Assessment Total Assessment is a certain percentage of the fair market value that is determined by local assessors to be the total taxable value of land and additions on the property. | Land | Improvement |
|---|---|---|---|---|
| 2024 | $4,163 | $82,120 | $11,170 | $70,950 |
| 2023 | $4,163 | $82,120 | $11,170 | $70,950 |
| 2022 | $3,305 | $59,910 | $8,950 | $50,960 |
| 2021 | $3,304 | $59,910 | $8,950 | $50,960 |
| 2020 | $3,329 | $59,910 | $8,950 | $50,960 |
| 2019 | $3,016 | $50,650 | $7,520 | $43,130 |
| 2018 | $2,991 | $50,650 | $7,520 | $43,130 |
| 2017 | $2,988 | $50,650 | $7,520 | $43,130 |
| 2016 | $3,040 | $51,240 | $7,140 | $44,100 |
| 2015 | $2,991 | $51,240 | $7,140 | $44,100 |
| 2014 | $2,980 | $51,240 | $7,140 | $44,100 |
| 2012 | $1,440 | $53,940 | $7,520 | $46,420 |
Source: Public Records
Map
Nearby Homes
- 2750 Lutz Ave
- 2641 State Route 430
- 0 Peterson Rd
- 0 Satinwood Dr
- 598 Impala Dr
- 630 Impala Dr
- 609 Mcbride Rd
- 2495 Emma Ln
- 0 McBride Road Parcel # 1 Unit 9066028
- 19 Maine St
- 1183 County Road 30a
- 2270 Lakecrest Dr Unit 2272
- 640 Running Brook Way
- 1156 County Road 2075
- 641 Laver Rd
- 76 Ford Rd N
- 76 Ford Rd N Unit 20
- 0 Mcelroy Rd
- 1910 Crider Rd
- 1997 Hout Rd