Estimated Value: $125,000 - $146,000
3
Beds
1
Bath
1,146
Sq Ft
$115/Sq Ft
Est. Value
About This Home
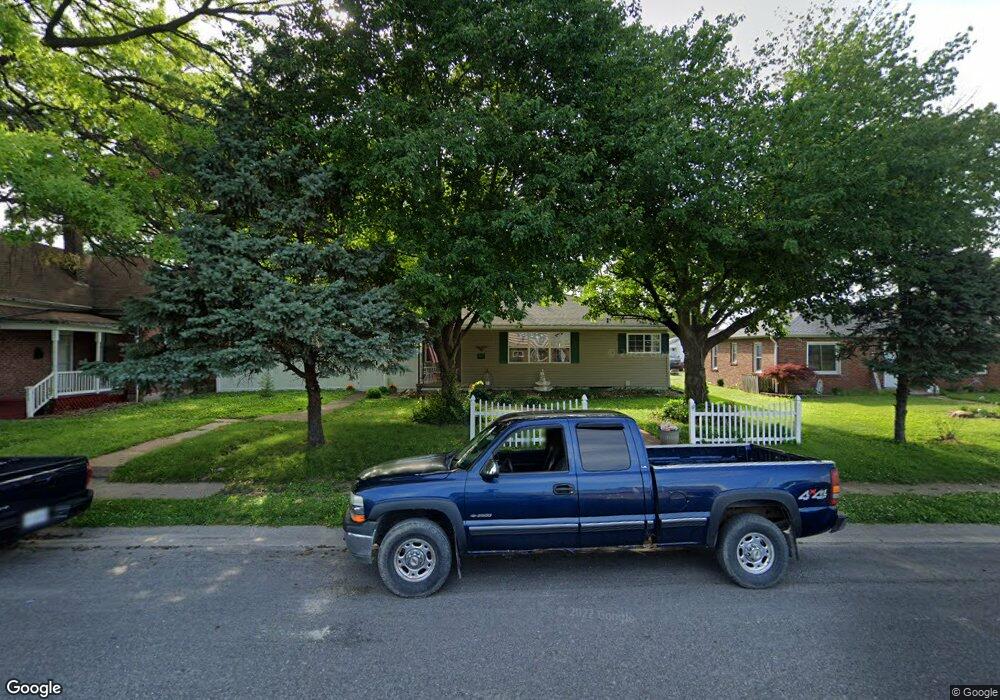
This home is located at 215 S 5th St, Dupo, IL 62239 and is currently estimated at $132,042, approximately $115 per square foot. 215 S 5th St is a home located in St. Clair County with nearby schools including Bluffview Elementary School and Dupo High School.
Ownership History
Date
Name
Owned For
Owner Type
Purchase Details
Closed on
Oct 21, 2011
Sold by
Rinehart Tami L
Bought by
Levin William L and Levin Judith A
Current Estimated Value
Purchase Details
Closed on
May 18, 2010
Sold by
Fannie Mae
Bought by
Rinehart Tami L
Home Financials for this Owner
Home Financials are based on the most recent Mortgage that was taken out on this home.
Original Mortgage
$22,500
Interest Rate
5.5%
Mortgage Type
Purchase Money Mortgage
Purchase Details
Closed on
Jan 13, 2010
Sold by
Pankey Earline
Bought by
Federal National Mortgage Association
Purchase Details
Closed on
Jul 28, 2005
Sold by
Touchette Joan Marie and Touchette George
Bought by
Pankey Earline
Home Financials for this Owner
Home Financials are based on the most recent Mortgage that was taken out on this home.
Original Mortgage
$145,500
Interest Rate
5.34%
Mortgage Type
FHA
Create a Home Valuation Report for This Property
The Home Valuation Report is an in-depth analysis detailing your home's value as well as a comparison with similar homes in the area
Home Values in the Area
Average Home Value in this Area
Purchase History
| Date | Buyer | Sale Price | Title Company |
|---|---|---|---|
| Levin William L | -- | None Available | |
| Rinehart Tami L | $30,000 | Fatic | |
| Federal National Mortgage Association | -- | None Available | |
| Pankey Earline | -- | -- |
Source: Public Records
Mortgage History
| Date | Status | Borrower | Loan Amount |
|---|---|---|---|
| Previous Owner | Rinehart Tami L | $22,500 | |
| Previous Owner | Pankey Earline | $145,500 |
Source: Public Records
Tax History Compared to Growth
Tax History
| Year | Tax Paid | Tax Assessment Tax Assessment Total Assessment is a certain percentage of the fair market value that is determined by local assessors to be the total taxable value of land and additions on the property. | Land | Improvement |
|---|---|---|---|---|
| 2024 | $1,111 | $37,779 | $4,115 | $33,664 |
| 2023 | $1,241 | $35,104 | $3,824 | $31,280 |
| 2022 | $1,184 | $32,928 | $3,587 | $29,341 |
| 2021 | $1,221 | $30,988 | $3,376 | $27,612 |
| 2020 | $1,223 | $28,397 | $3,092 | $25,305 |
| 2019 | $1,228 | $28,397 | $3,092 | $25,305 |
| 2018 | $1,553 | $27,094 | $2,950 | $24,144 |
| 2017 | $1,297 | $25,177 | $2,741 | $22,436 |
| 2016 | $1,148 | $21,237 | $2,649 | $18,588 |
| 2014 | $496 | $21,237 | $2,649 | $18,588 |
| 2013 | $585 | $21,731 | $2,711 | $19,020 |
Source: Public Records
Map
Nearby Homes