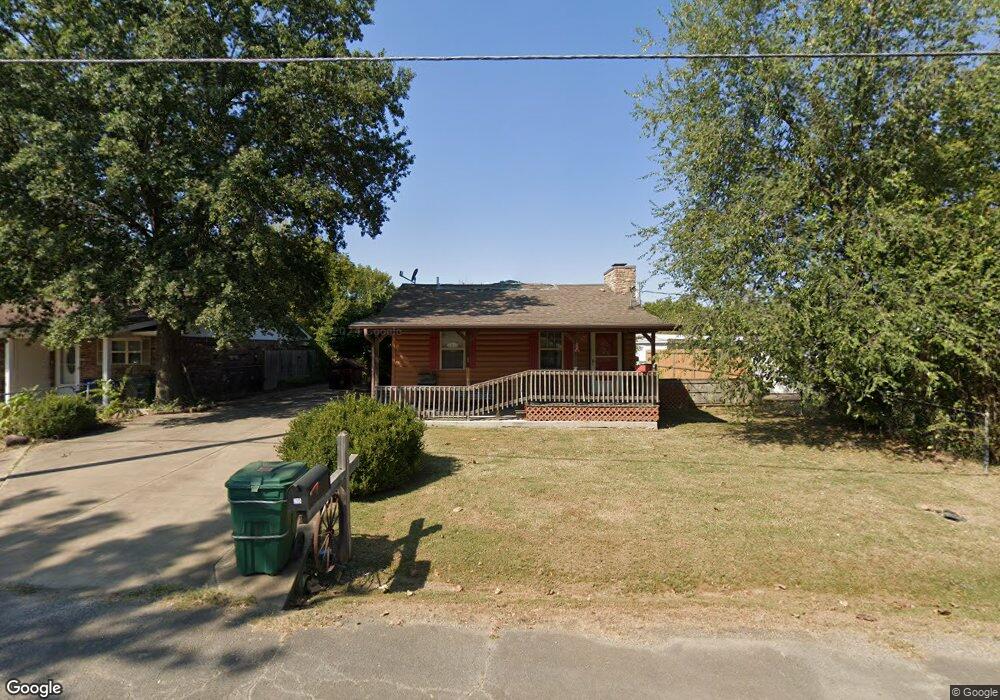
215 S Cedar St Sallisaw, OK 74955
Estimated Value: $42,000 - $76,760
2
Beds
2
Baths
528
Sq Ft
$114/Sq Ft
Est. Value
About This Home
This home is located at 215 S Cedar St, Sallisaw, OK 74955 and is currently estimated at $60,440, approximately $114 per square foot. 215 S Cedar St is a home with nearby schools including Liberty Elementary School, Eastside Elementary School, and Sallisaw Middle School.
Ownership History
Date
Name
Owned For
Owner Type
Purchase Details
Closed on
Feb 24, 2021
Sold by
Long Thomas and Henry Ruby A
Bought by
Henry Joshton N
Current Estimated Value
Purchase Details
Closed on
Feb 21, 2020
Sold by
Love Debra and Marley Larry
Bought by
Long Thomas and Henry Ruby A
Purchase Details
Closed on
Oct 13, 2009
Sold by
Bo Properties Llc
Bought by
Bo Properties Llc
Purchase Details
Closed on
Dec 17, 2007
Sold by
Marley Larry
Bought by
Bo Bo Properties Llc
Home Financials for this Owner
Home Financials are based on the most recent Mortgage that was taken out on this home.
Original Mortgage
$28,000
Interest Rate
6.3%
Mortgage Type
New Conventional
Purchase Details
Closed on
Dec 4, 2007
Sold by
Bo Bo Properies Llc
Bought by
Marley Larry
Home Financials for this Owner
Home Financials are based on the most recent Mortgage that was taken out on this home.
Original Mortgage
$28,000
Interest Rate
6.3%
Mortgage Type
New Conventional
Create a Home Valuation Report for This Property
The Home Valuation Report is an in-depth analysis detailing your home's value as well as a comparison with similar homes in the area
Home Values in the Area
Average Home Value in this Area
Purchase History
| Date | Buyer | Sale Price | Title Company |
|---|---|---|---|
| Henry Joshton N | $32,000 | None Listed On Document | |
| Long Thomas | $32,000 | Valley Land Title Company | |
| Bo Properties Llc | -- | None Available | |
| Bo Bo Properties Llc | -- | None Available | |
| Marley Larry | -- | None Available |
Source: Public Records
Mortgage History
| Date | Status | Borrower | Loan Amount |
|---|---|---|---|
| Previous Owner | Marley Larry | $28,000 |
Source: Public Records
Tax History Compared to Growth
Tax History
| Year | Tax Paid | Tax Assessment Tax Assessment Total Assessment is a certain percentage of the fair market value that is determined by local assessors to be the total taxable value of land and additions on the property. | Land | Improvement |
|---|---|---|---|---|
| 2024 | $350 | $4,855 | $1,203 | $3,652 |
| 2023 | $350 | $4,715 | $1,155 | $3,560 |
| 2022 | $313 | $4,670 | $1,155 | $3,515 |
| 2021 | $397 | $4,670 | $1,155 | $3,515 |
| 2020 | $385 | $4,445 | $1,082 | $3,363 |
| 2019 | $371 | $4,234 | $1,013 | $3,221 |
| 2018 | $356 | $4,032 | $363 | $3,669 |
| 2017 | $365 | $4,136 | $363 | $3,773 |
| 2016 | $378 | $4,235 | $363 | $3,872 |
| 2015 | $394 | $4,340 | $363 | $3,977 |
| 2014 | $223 | $2,453 | $363 | $2,090 |
Source: Public Records
Map
Nearby Homes
- 218 W Chickasaw Ave
- 205 W Port Arthur Ave
- 808 W Chickasaw Ave
- 402 S Ash St
- 814 W Chickasaw Ave
- 714 W Williams Ave
- 418 S Hickory St
- 891 W Choctaw Ave
- 403 N Maple St
- 310 W Denton Ave
- 204 W Denton Ave
- 322 S Locust St
- 401 N Ash St
- 404 N Washington St
- 610 N Hickory St
- 605 N Maple St
- 0 Rural Route Unit 2535327
- 428 N Elm St
- TBD E 1070 Rd
- 403 W Argyle Ave