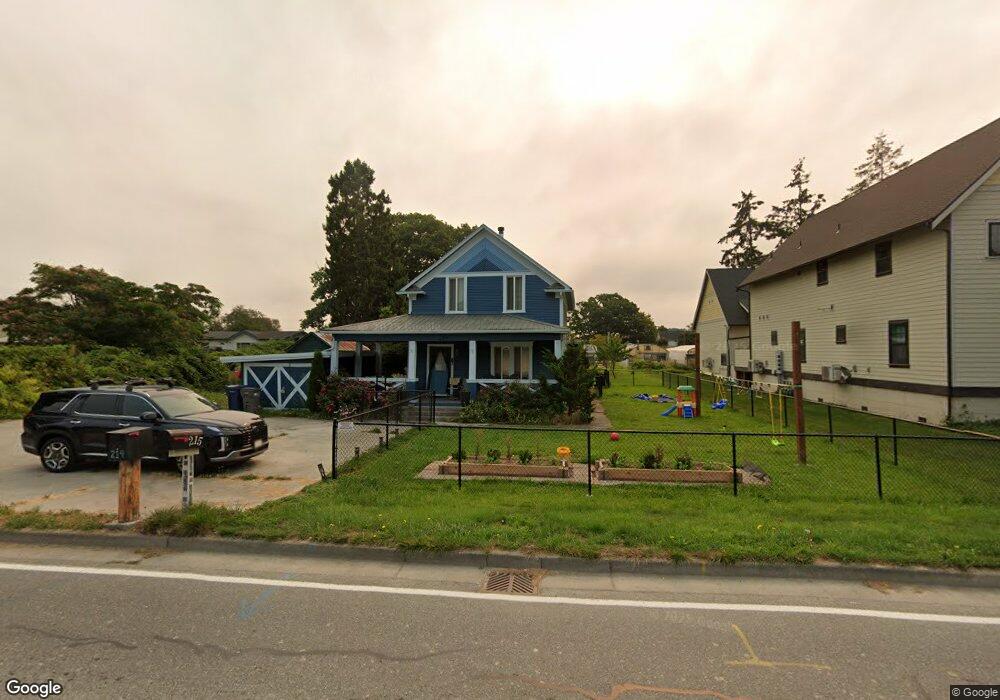
215 S Maple St La Conner, WA 98257
Estimated Value: $550,000 - $610,000
3
Beds
2
Baths
1,728
Sq Ft
$339/Sq Ft
Est. Value
About This Home
This home is located at 215 S Maple St, La Conner, WA 98257 and is currently estimated at $586,434, approximately $339 per square foot. 215 S Maple St is a home located in Skagit County with nearby schools including La Conner Elementary School and La Conner Middle and High Schools.
Ownership History
Date
Name
Owned For
Owner Type
Purchase Details
Closed on
Sep 27, 2018
Sold by
Medeiros Ryan C and Medeiros Kristen A
Bought by
Mcgarity Adam John and Lavoie Mcgarity Nichole J
Current Estimated Value
Home Financials for this Owner
Home Financials are based on the most recent Mortgage that was taken out on this home.
Original Mortgage
$375,000
Outstanding Balance
$327,718
Interest Rate
4.6%
Mortgage Type
VA
Estimated Equity
$258,716
Purchase Details
Closed on
Jun 28, 2017
Sold by
Ballard Barbarra J and Eubanks Michael
Bought by
Medeiros Ryan C and Medeiros Kristen A
Home Financials for this Owner
Home Financials are based on the most recent Mortgage that was taken out on this home.
Original Mortgage
$188,000
Interest Rate
4.02%
Mortgage Type
New Conventional
Purchase Details
Closed on
Feb 3, 2011
Sold by
Bowman Dorothy E
Bought by
Ballard Barbara J and Eubanks Michael
Create a Home Valuation Report for This Property
The Home Valuation Report is an in-depth analysis detailing your home's value as well as a comparison with similar homes in the area
Home Values in the Area
Average Home Value in this Area
Purchase History
| Date | Buyer | Sale Price | Title Company |
|---|---|---|---|
| Mcgarity Adam John | $390,000 | Chicag Title | |
| Medeiros Ryan C | $271,000 | Land Title & Escrow Of Skagi | |
| Ballard Barbara J | -- | None Available |
Source: Public Records
Mortgage History
| Date | Status | Borrower | Loan Amount |
|---|---|---|---|
| Open | Mcgarity Adam John | $375,000 | |
| Previous Owner | Medeiros Ryan C | $188,000 |
Source: Public Records
Tax History Compared to Growth
Tax History
| Year | Tax Paid | Tax Assessment Tax Assessment Total Assessment is a certain percentage of the fair market value that is determined by local assessors to be the total taxable value of land and additions on the property. | Land | Improvement |
|---|---|---|---|---|
| 2024 | $3,619 | $489,000 | $274,000 | $215,000 |
| 2023 | $3,619 | $440,600 | $244,700 | $195,900 |
| 2022 | $3,600 | $415,700 | $232,200 | $183,500 |
| 2021 | $3,265 | $370,300 | $220,900 | $149,400 |
| 2020 | $3,002 | $302,500 | $0 | $0 |
| 2019 | $2,821 | $269,500 | $0 | $0 |
| 2018 | $2,879 | $256,900 | $0 | $0 |
| 2017 | $3,021 | $232,100 | $0 | $0 |
| 2016 | $3,014 | $255,800 | $119,000 | $136,800 |
| 2015 | $2,985 | $221,700 | $103,100 | $118,600 |
| 2013 | $2,715 | $186,100 | $0 | $0 |
Source: Public Records
Map
Nearby Homes
- 206 Dalan Place
- 215 N 6th St
- 220 Morris St
- 313 Centre St
- 307 Centre St
- 516 Myrtle St
- 524 Myrtle St Unit C & D
- 611 Whatcom St
- 708 Finley Ln Unit S4
- 602 S 3rd St
- 81 Swinomish Dr
- 56 Sauk Place
- 146 Lummi Dr
- 24 Makah Way
- 116 Lummi Dr
- 132 Lummi Dr
- 220 Skagit Way
- 399 Tilingit Place
- 266 Quillayute Place
- 379 Snohomish Dr