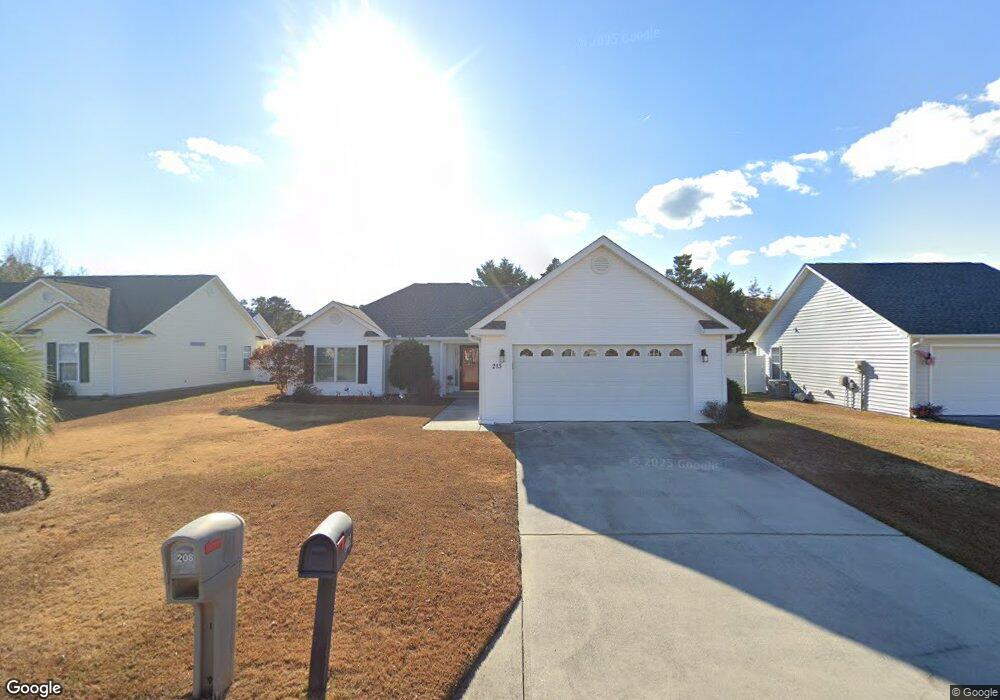
215 Sienna Dr Unit LR Little River, SC 29566
Estimated Value: $284,484 - $316,000
3
Beds
2
Baths
1,442
Sq Ft
$212/Sq Ft
Est. Value
About This Home
This home is located at 215 Sienna Dr Unit LR, Little River, SC 29566 and is currently estimated at $305,371, approximately $211 per square foot. 215 Sienna Dr Unit LR is a home located in Horry County with nearby schools including Waterway Elementary School, North Myrtle Beach Middle School, and North Myrtle Beach High School.
Ownership History
Date
Name
Owned For
Owner Type
Purchase Details
Closed on
Aug 28, 2025
Sold by
Pfleager Edward J
Bought by
Pfleager Edward J and Pfleager Barbara R
Current Estimated Value
Purchase Details
Closed on
Feb 20, 2004
Sold by
Minshall William and Minshall Rita J
Bought by
Pfleager Edward J and Pfleager Barbara R
Home Financials for this Owner
Home Financials are based on the most recent Mortgage that was taken out on this home.
Original Mortgage
$75,000
Interest Rate
5.63%
Mortgage Type
Purchase Money Mortgage
Purchase Details
Closed on
Oct 1, 2001
Sold by
Wwm Construction & Development Inc
Bought by
Minshall William and Minshall Rita J
Home Financials for this Owner
Home Financials are based on the most recent Mortgage that was taken out on this home.
Original Mortgage
$45,000
Interest Rate
6.87%
Mortgage Type
Purchase Money Mortgage
Purchase Details
Closed on
Jun 14, 2001
Sold by
Cap Care Group Inc
Bought by
Wwm Construction & Development Inc
Create a Home Valuation Report for This Property
The Home Valuation Report is an in-depth analysis detailing your home's value as well as a comparison with similar homes in the area
Home Values in the Area
Average Home Value in this Area
Purchase History
| Date | Buyer | Sale Price | Title Company |
|---|---|---|---|
| Pfleager Edward J | -- | -- | |
| Pfleager Edward J | $141,000 | -- | |
| Minshall William | $122,200 | -- | |
| Wwm Construction & Development Inc | $21,500 | -- |
Source: Public Records
Mortgage History
| Date | Status | Borrower | Loan Amount |
|---|---|---|---|
| Previous Owner | Pfleager Edward J | $75,000 | |
| Previous Owner | Minshall William | $45,000 |
Source: Public Records
Tax History Compared to Growth
Tax History
| Year | Tax Paid | Tax Assessment Tax Assessment Total Assessment is a certain percentage of the fair market value that is determined by local assessors to be the total taxable value of land and additions on the property. | Land | Improvement |
|---|---|---|---|---|
| 2024 | $441 | $10,909 | $3,600 | $7,309 |
| 2023 | $441 | $5,072 | $1,300 | $3,772 |
| 2021 | $380 | $5,072 | $1,300 | $3,772 |
| 2020 | $311 | $5,072 | $1,300 | $3,772 |
| 2019 | $311 | $5,072 | $1,300 | $3,772 |
| 2018 | $310 | $4,956 | $1,300 | $3,656 |
| 2017 | $295 | $4,956 | $1,300 | $3,656 |
| 2016 | -- | $4,956 | $1,300 | $3,656 |
| 2015 | $295 | $4,956 | $1,300 | $3,656 |
| 2014 | $273 | $4,956 | $1,300 | $3,656 |
Source: Public Records
Map
Nearby Homes
- 2636 Brick Dr Unit Colonial Club Estate
- 110 Ashworth Dr
- 127 Ashworth Dr
- 2248 Seaford Dr
- 2216 Seaford Dr
- 2501 Stonesedge Blvd
- 305 Opal Ave
- 271 Sienna Dr
- 2425 Bittar Spar Rd
- 2532 Stonesedge Blvd
- 317 Opal Ave
- TBD3 Kapalua Loop
- 2744 Desert Rose St
- 35 Palmetto Green Dr
- 35 Palmetto Green Dr Unit Colonia Charters
- 408 Alabaster Ct Unit Lot 39; Stones Edge
- 123 Retreat Place
- 66 Palmetto Green Dr
- 108 Nunn Ct
- 509 Shellbank Dr Unit B
- 213 Sienna Dr
- Lot 86 Sienna Dr
- 2355 Seaford Dr
- 735 Wailea Cir
- 735 Wailea Cir Unit Lot 147 Hickory Arts
- 510 Kapalua Loop Unit Lot 49
- 510 Kapalua Loop
- 525 Kapalua Loop
- 521 Kapalua Loop Unit Lot 86
- 525 Kapalua Loop Unit Lot 85
- 2365 Seaford Dr
- 2365 Seaford Dr Unit Patriots Point
- 219 Sienna Dr
- 2345 Seaford Dr
- 2345 Seaford Dr Unit Lot 23 Patriot Point
- 2345 Seaford Dr Unit Patriot's Pointe
- 2375 Seaford Dr
- 211 Sienna Dr
- 208 Sienna Dr
- 216 Sienna Dr