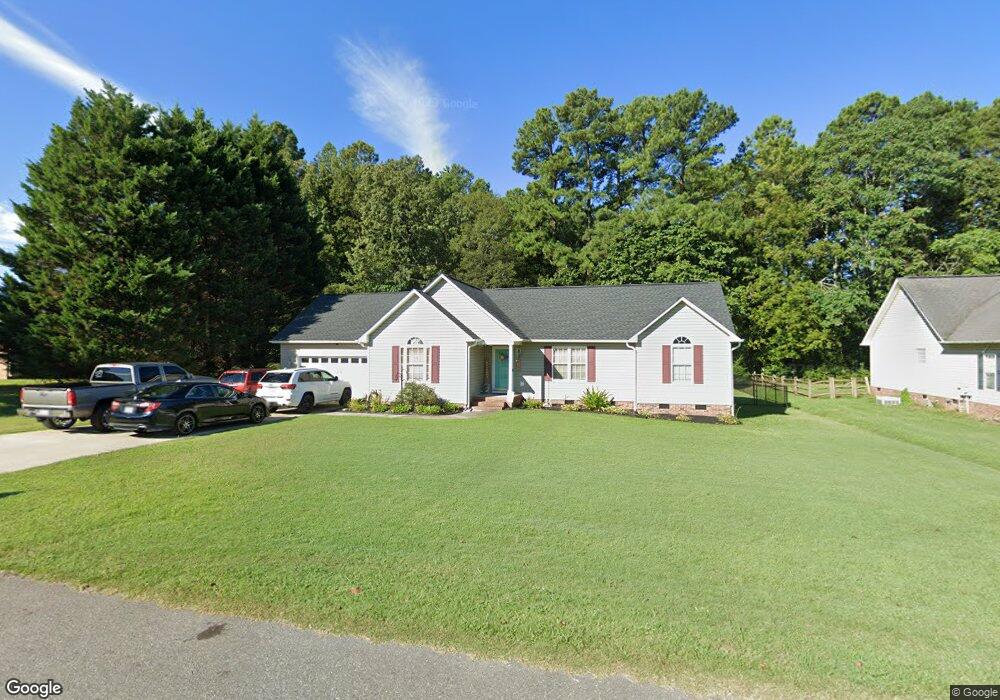
215 Summey Barker Dr Dallas, NC 28034
Estimated Value: $323,000 - $345,000
3
Beds
2
Baths
1,487
Sq Ft
$225/Sq Ft
Est. Value
About This Home
This home is located at 215 Summey Barker Dr, Dallas, NC 28034 and is currently estimated at $335,216, approximately $225 per square foot. 215 Summey Barker Dr is a home located in Gaston County with nearby schools including Costner Elementary School, W.C. Friday Middle School, and North Gaston High School.
Ownership History
Date
Name
Owned For
Owner Type
Purchase Details
Closed on
Jun 11, 2014
Sold by
Lamley Angela Radfor
Bought by
Lemley Jeffery Scott
Current Estimated Value
Purchase Details
Closed on
Aug 22, 2003
Sold by
Prudential Residential Services Lp
Bought by
Lemley Jeffrey Scott
Home Financials for this Owner
Home Financials are based on the most recent Mortgage that was taken out on this home.
Original Mortgage
$125,125
Outstanding Balance
$55,501
Interest Rate
5.72%
Mortgage Type
Purchase Money Mortgage
Estimated Equity
$279,715
Purchase Details
Closed on
Jul 30, 1999
Sold by
Castlegate Construction Co Inc
Bought by
Plunkett Kenneth D and Brown Plunkett Keisha
Home Financials for this Owner
Home Financials are based on the most recent Mortgage that was taken out on this home.
Original Mortgage
$112,321
Interest Rate
7.66%
Mortgage Type
FHA
Create a Home Valuation Report for This Property
The Home Valuation Report is an in-depth analysis detailing your home's value as well as a comparison with similar homes in the area
Home Values in the Area
Average Home Value in this Area
Purchase History
| Date | Buyer | Sale Price | Title Company |
|---|---|---|---|
| Lemley Jeffery Scott | -- | None Available | |
| Lemley Jeffrey Scott | $129,000 | -- | |
| Plunkett Kenneth D | $113,500 | -- |
Source: Public Records
Mortgage History
| Date | Status | Borrower | Loan Amount |
|---|---|---|---|
| Open | Lemley Jeffrey Scott | $125,125 | |
| Previous Owner | Plunkett Kenneth D | $112,321 |
Source: Public Records
Tax History Compared to Growth
Tax History
| Year | Tax Paid | Tax Assessment Tax Assessment Total Assessment is a certain percentage of the fair market value that is determined by local assessors to be the total taxable value of land and additions on the property. | Land | Improvement |
|---|---|---|---|---|
| 2025 | $2,998 | $288,520 | $26,500 | $262,020 |
| 2024 | $2,940 | $288,520 | $26,500 | $262,020 |
| 2023 | $2,972 | $288,520 | $26,500 | $262,020 |
| 2022 | $1,958 | $159,180 | $22,500 | $136,680 |
| 2021 | $1,990 | $159,180 | $22,500 | $136,680 |
| 2019 | $1,974 | $159,180 | $22,500 | $136,680 |
| 2018 | $1,688 | $132,883 | $22,400 | $110,483 |
| 2017 | $1,688 | $132,883 | $22,400 | $110,483 |
| 2016 | $1,688 | $132,883 | $0 | $0 |
| 2014 | $1,739 | $139,142 | $30,000 | $109,142 |
Source: Public Records
Map
Nearby Homes
- 111 Summey Barker Dr
- 00 Summey Farm Dr
- 4040 Hereford Ln
- 600 Summey Farm Dr
- 2017 Longhorn Dr
- 4016 Hereford Ln
- 912 Carole Summey Dr
- 322 Pinkney Rd
- 1001 College Blvd
- 3259 Winesap Dr
- 109 Churchill Rd
- 3173 Green Apple Dr
- 3120 Green Apple Dr
- 5606 Katherine Ct
- 2612 Mcintosh St
- 6103 Dane Dr
- 2504 Mcintosh St
- 3032 Green Apple Dr
- 000 Dallas Cherryville Hwy
- 5117 Park Place Dr
- 219 Summey Barker Dr
- 211 Summey Barker Dr
- 205 Summey Barker Dr
- 223 Summey Barker Dr
- 214 Summey Barker Dr
- 210 Summey Barker Dr
- 218 Summey Barker Dr
- 222 Summey Barker Dr
- 201 Summey Barker Dr
- 225 Summey Barker Dr
- 226 Summey Barker Dr
- 349 Holstein Dr
- 349 Holstein Dr Unit 34
- 141 Summey Barker Dr
- 202 Summey Barker Dr
- 345 Holstein Dr
- 341 Holstein Dr
- 353 Holstein Dr
- 227 Summey Barker Dr
- 337 Holstein Dr