Estimated Value: $171,000 - $204,000
2
Beds
1
Bath
900
Sq Ft
$214/Sq Ft
Est. Value
About This Home
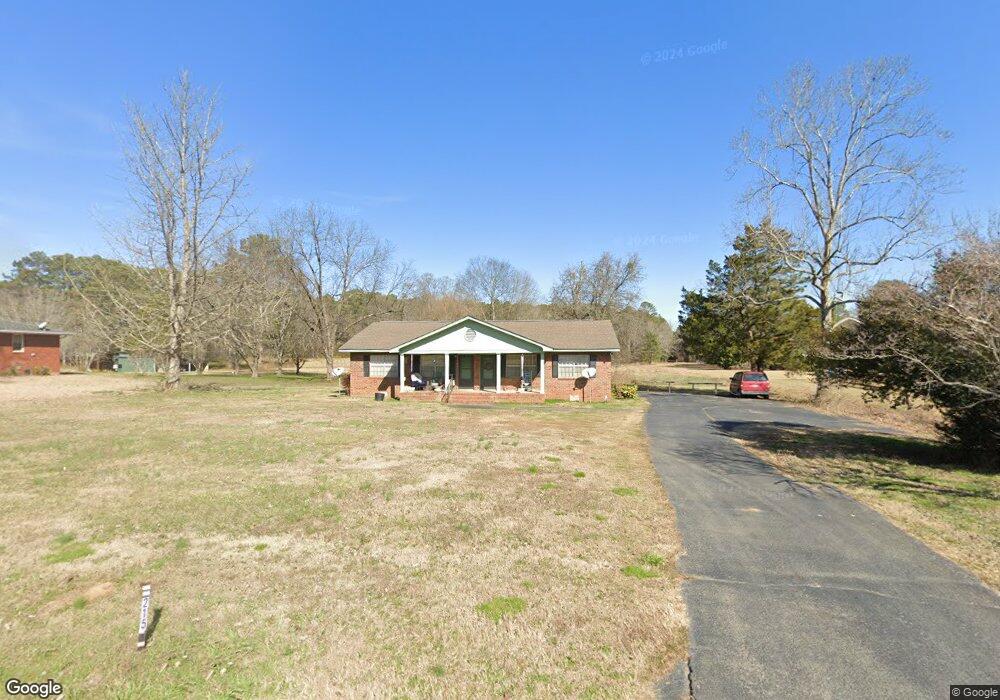
This home is located at 215 Wayside Rd NE, Rome, GA 30161 and is currently estimated at $192,356, approximately $213 per square foot. 215 Wayside Rd NE is a home located in Floyd County with nearby schools including Model Middle School, Model High School, and Unity Christian School.
Ownership History
Date
Name
Owned For
Owner Type
Purchase Details
Closed on
Apr 14, 2025
Sold by
Montgomery Richard A
Bought by
Montgomery Richard A and Montgomery Annette H
Current Estimated Value
Purchase Details
Closed on
Jul 16, 2004
Bought by
P and R
Purchase Details
Closed on
May 5, 2004
Sold by
Wright Frances Callaway
Bought by
Worley Frances Wright
Purchase Details
Closed on
May 30, 1994
Sold by
Wright James Eugene 3 and Int 4
Bought by
Wright Frances Callaway
Purchase Details
Closed on
Apr 22, 1994
Sold by
Wright James Eugene and Patricia Wright Fr
Bought by
Wright James Eugene 3 and Int 4
Purchase Details
Closed on
Apr 12, 1994
Bought by
P and R
Purchase Details
Closed on
Jan 1, 1994
Sold by
Wright Louise J Mrs
Bought by
Wright James Eugene and Patricia Wrig
Purchase Details
Closed on
Jul 29, 1971
Sold by
Wright James E and Wright Frances C
Bought by
Wright Louise J Mrs
Purchase Details
Closed on
Jan 1, 1971
Bought by
Wright James E and Wright Frances C
Create a Home Valuation Report for This Property
The Home Valuation Report is an in-depth analysis detailing your home's value as well as a comparison with similar homes in the area
Home Values in the Area
Average Home Value in this Area
Purchase History
| Date | Buyer | Sale Price | Title Company |
|---|---|---|---|
| Montgomery Richard A | -- | -- | |
| Montgomery Richard A | $190,000 | -- | |
| P | -- | -- | |
| Worley Donald Alton | -- | -- | |
| Worley Frances Wright | -- | -- | |
| Wright Frances Callaway | -- | -- | |
| P | -- | -- | |
| Wright James Eugene 3 | -- | -- | |
| P | -- | -- | |
| Wright James Eugene | -- | -- | |
| Wright Louise J Mrs | -- | -- | |
| Wright James E | -- | -- |
Source: Public Records
Tax History Compared to Growth
Tax History
| Year | Tax Paid | Tax Assessment Tax Assessment Total Assessment is a certain percentage of the fair market value that is determined by local assessors to be the total taxable value of land and additions on the property. | Land | Improvement |
|---|---|---|---|---|
| 2024 | $2,279 | $72,704 | $1,656 | $71,048 |
| 2023 | $2,080 | $69,245 | $1,505 | $67,740 |
| 2022 | $1,432 | $56,787 | $1,246 | $55,541 |
| 2021 | $931 | $30,856 | $1,144 | $29,712 |
| 2020 | $890 | $29,228 | $995 | $28,233 |
| 2019 | $832 | $27,692 | $995 | $26,697 |
| 2018 | $736 | $24,477 | $948 | $23,529 |
| 2017 | $714 | $23,668 | $878 | $22,790 |
| 2016 | $660 | $21,634 | $840 | $20,794 |
| 2015 | $646 | $21,634 | $840 | $20,794 |
| 2014 | $646 | $21,634 | $840 | $20,794 |
Source: Public Records
Map
Nearby Homes
- 197 Wayside Rd NE
- 5 Larkwood Dr NE
- 424 Wayside Rd NE
- 0 Calhoun Rd NE Unit 7516251
- 0 Calhoun Rd NE Unit 10488821
- 608 Wayside Rd NE
- 109 Dekle Dr NE
- 637 Wayside Rd NE
- 16 Maycroft Ct
- 13 Maycroft Ct
- 118 Dekle Dr NE
- 108 Dekle Dr NE
- 3 Dekle Dr NE
- 26 Greer Dr NE
- 0 Scarlett Ln Unit 10548767
- 0 Scarlett Ln Unit 7601914
- 58 Wade St NE
- 0 Carrington Place NE Unit 7512224
- 0 Carrington Place NE Unit 10443994
- 84 Harris Rd NE
- 255 Wayside Rd NE
- 0 Wildwood Ln NE Unit 8223625
- 0 Wildwood Ln NE
- 0 Wildwood Ln NE Unit 6974180
- 0 Wildwood Ln NE Unit 20003010
- 0 Wildwood Ln NE Unit 5878152
- 197 Wayside Rd NE
- 212 Wayside Rd NE
- 194 Wayside Rd NE
- 1 Wildwood Ln NE
- 2228 Wayside Rd
- 4 Wildwood Ln NE
- 3305 Wayside Rd
- 210 Wayside Rd NE
- 1 Chula Vista Dr NE
- 170 Wayside Rd NE
- 170 Wayside Rd NE
- 6 Wildwood Ln NE
- 6 Wildwood Ln NE
- 270 Wayside Rd NE