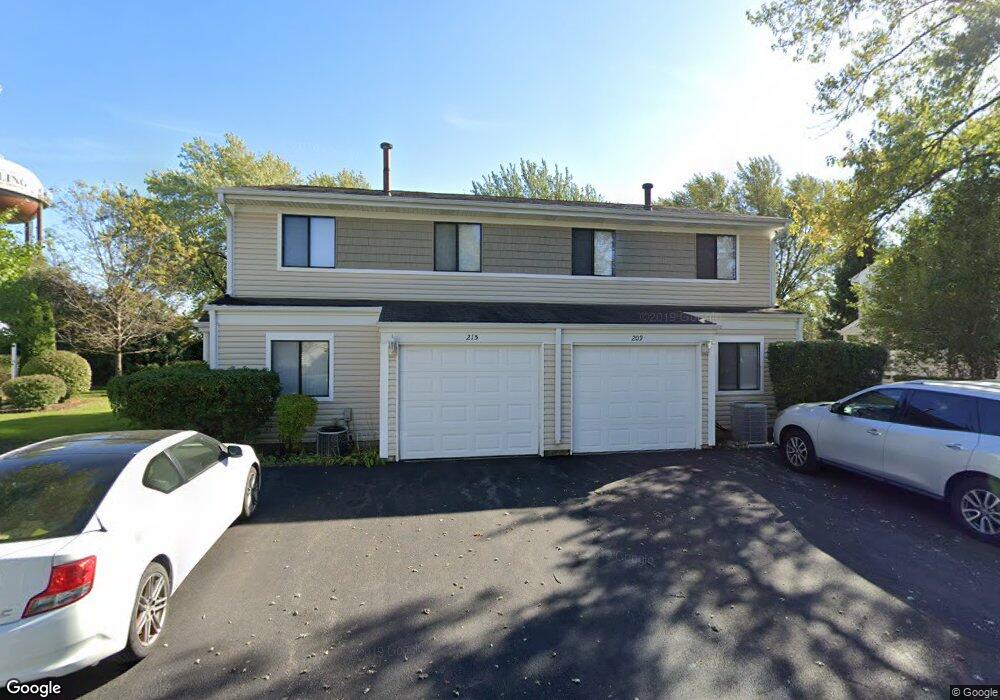
215 Yorkshire Place Unit 16A Wheeling, IL 60090
Estimated Value: $273,000 - $342,000
3
Beds
--
Bath
3,080
Sq Ft
$97/Sq Ft
Est. Value
About This Home
This home is located at 215 Yorkshire Place Unit 16A, Wheeling, IL 60090 and is currently estimated at $298,914, approximately $97 per square foot. 215 Yorkshire Place Unit 16A is a home located in Cook County with nearby schools including Eugene Field Elementary School, Jack London Middle School, and Buffalo Grove High School.
Ownership History
Date
Name
Owned For
Owner Type
Purchase Details
Closed on
May 27, 2016
Sold by
Amschwand Madeleine E and Madeleine Amschwand Revocable
Bought by
Pak Francis
Current Estimated Value
Home Financials for this Owner
Home Financials are based on the most recent Mortgage that was taken out on this home.
Original Mortgage
$70,000
Outstanding Balance
$55,875
Interest Rate
3.66%
Mortgage Type
New Conventional
Estimated Equity
$243,039
Purchase Details
Closed on
Nov 1, 2001
Sold by
Amschwand Madeleine
Bought by
Madeleine Amschwand Revocable Living Tr
Purchase Details
Closed on
May 17, 1996
Sold by
Doetsch Matthew J and Doetsch Jean K
Bought by
Amschwand Madeleine E
Home Financials for this Owner
Home Financials are based on the most recent Mortgage that was taken out on this home.
Original Mortgage
$35,000
Interest Rate
7.99%
Create a Home Valuation Report for This Property
The Home Valuation Report is an in-depth analysis detailing your home's value as well as a comparison with similar homes in the area
Home Values in the Area
Average Home Value in this Area
Purchase History
| Date | Buyer | Sale Price | Title Company |
|---|---|---|---|
| Pak Francis | $155,000 | Chicago Title | |
| Madeleine Amschwand Revocable Living Tr | -- | -- | |
| Amschwand Madeleine E | $117,000 | -- |
Source: Public Records
Mortgage History
| Date | Status | Borrower | Loan Amount |
|---|---|---|---|
| Open | Pak Francis | $70,000 | |
| Previous Owner | Amschwand Madeleine E | $35,000 |
Source: Public Records
Tax History Compared to Growth
Tax History
| Year | Tax Paid | Tax Assessment Tax Assessment Total Assessment is a certain percentage of the fair market value that is determined by local assessors to be the total taxable value of land and additions on the property. | Land | Improvement |
|---|---|---|---|---|
| 2024 | $5,100 | $18,535 | $4,756 | $13,779 |
| 2023 | $4,830 | $18,535 | $4,756 | $13,779 |
| 2022 | $4,830 | $18,535 | $4,756 | $13,779 |
| 2021 | $4,477 | $15,413 | $792 | $14,621 |
| 2020 | $4,442 | $15,413 | $792 | $14,621 |
| 2019 | $4,528 | $17,248 | $792 | $16,456 |
| 2018 | $4,255 | $11,659 | $634 | $11,025 |
| 2017 | $4,168 | $11,659 | $634 | $11,025 |
| 2016 | $3,890 | $11,659 | $634 | $11,025 |
| 2015 | $1,391 | $8,420 | $2,694 | $5,726 |
| 2014 | $1,328 | $8,420 | $2,694 | $5,726 |
| 2013 | $1,256 | $8,420 | $2,694 | $5,726 |
Source: Public Records
Map
Nearby Homes
- 275 London Place Unit 22B
- 289 London Place Unit 23A
- 722 Sutton Cir Unit 31
- 803 Valley Stream Dr
- 738 Brandon Place Unit 104
- 493 Mchenry Rd Unit 3B
- 841 Oxford Place Unit 109C
- 905 Wilshire Dr
- 928 Woodland Dr
- 271 Northgate Pkwy Unit E
- 854 Cambridge Place Unit 128
- 266 12th St Unit 3
- 908 Jenkins Ct
- 267 12th St Unit 6
- 1005 Valley Stream Dr
- 665 Cindy Ln
- 934 N Norman Ln
- 1050 Southbury Ln Unit C2
- 1059 Southbury Ln Unit 1
- 295 E Dennis Rd
- 215 Yorkshire Place Unit 215
- 209 Yorkshire Place Unit 16B
- 217 Yorkshire Place Unit 17B
- 223 Yorkshire Place Unit 17A
- 207 Yorkshire Place Unit 15A
- 676 Brighton Place Unit 14B
- 201 Yorkshire Place Unit 15B
- 682 Brighton Place Unit 14A
- 225 Yorkshire Place Unit 18B
- 691 Brighton Place Unit 12B
- 231 Yorkshire Place Unit 18A
- 693 Brighton Place Unit 11A
- 690 Brighton Place Unit 13A
- 699 Brighton Place Unit 11B
- 684 Brighton Place Unit 13B
- 251 London Place Unit 19B
- 15-16 Colonial Dr
- 257 London Place Unit 19A
- 631 Portsmouth Place Unit 25B
- 633 Portsmouth Place Unit 26A