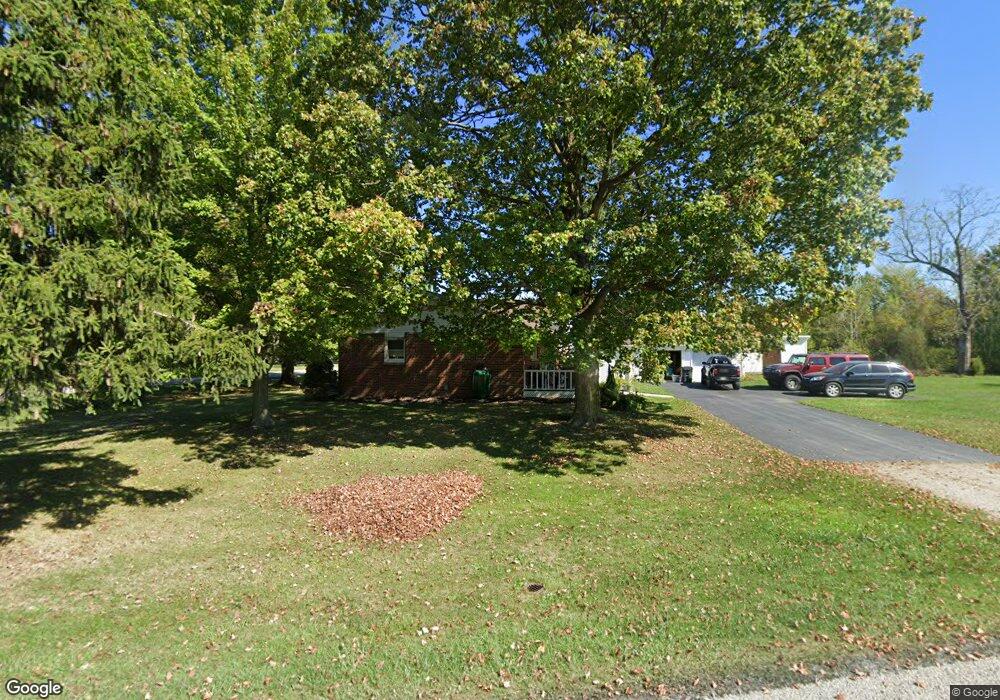
2150 Chenango Rd Wakeman, OH 44889
Estimated Value: $200,111 - $268,000
3
Beds
2
Baths
1,744
Sq Ft
$135/Sq Ft
Est. Value
About This Home
This home is located at 2150 Chenango Rd, Wakeman, OH 44889 and is currently estimated at $235,778, approximately $135 per square foot. 2150 Chenango Rd is a home located in Huron County with nearby schools including New London Elementary School, New London Middle School, and New London High School.
Ownership History
Date
Name
Owned For
Owner Type
Purchase Details
Closed on
Feb 4, 2023
Sold by
Pence Nancy L and The Estate Of Kathleen M Gibson
Bought by
Pence Nancy L and Pence Y
Current Estimated Value
Purchase Details
Closed on
Apr 26, 2011
Bought by
Kathleen M Gibson
Purchase Details
Closed on
Jan 21, 2010
Bought by
Gibson Glenn C and Gibson Kathleen M
Purchase Details
Closed on
May 15, 2009
Bought by
Glenn C Gibson
Purchase Details
Closed on
Dec 18, 2007
Bought by
Roby Donna L
Purchase Details
Closed on
May 12, 1995
Sold by
Harsar Herbert H
Bought by
Roby Jimmie H and Roby Donna L
Home Financials for this Owner
Home Financials are based on the most recent Mortgage that was taken out on this home.
Original Mortgage
$38,000
Interest Rate
8.39%
Mortgage Type
New Conventional
Create a Home Valuation Report for This Property
The Home Valuation Report is an in-depth analysis detailing your home's value as well as a comparison with similar homes in the area
Purchase History
| Date | Buyer | Sale Price | Title Company |
|---|---|---|---|
| Pence Nancy L | -- | Guardian Title | |
| Kathleen M Gibson | -- | -- | |
| Gibson Glenn C | -- | -- | |
| Glenn C Gibson | $98,500 | -- | |
| Roby Donna L | -- | -- | |
| Roby Jimmie H | $75,000 | -- | |
| Roby Jimmie H | $75,000 | -- |
Source: Public Records
Mortgage History
| Date | Status | Borrower | Loan Amount |
|---|---|---|---|
| Previous Owner | Roby Jimmie H | $38,000 |
Source: Public Records
Tax History
| Year | Tax Paid | Tax Assessment Tax Assessment Total Assessment is a certain percentage of the fair market value that is determined by local assessors to be the total taxable value of land and additions on the property. | Land | Improvement |
|---|---|---|---|---|
| 2024 | $1,778 | $52,600 | $5,740 | $46,860 |
| 2023 | $1,771 | $40,910 | $4,880 | $36,030 |
| 2022 | $1,046 | $40,910 | $4,880 | $36,030 |
| 2021 | $1,047 | $40,910 | $4,880 | $36,030 |
| 2020 | $888 | $33,710 | $4,880 | $28,830 |
| 2019 | $883 | $33,710 | $4,880 | $28,830 |
| 2018 | $865 | $33,710 | $4,880 | $28,830 |
| 2017 | $668 | $28,990 | $4,880 | $24,110 |
| 2016 | $657 | $28,990 | $4,880 | $24,110 |
| 2015 | $649 | $28,770 | $4,880 | $23,890 |
| 2014 | $670 | $29,060 | $4,870 | $24,190 |
| 2013 | $663 | $29,060 | $4,870 | $24,190 |
Source: Public Records
Map
Nearby Homes
- 1491 Vesta Rd
- 937 Chenango Rd
- 4512 Wenz Rd
- 5951 Ohio 303
- 0 0 St Rt 18 E Unit 20260708
- 1910 Wenz Rd
- 34 Cherdon Cir
- 3989 Court Rd
- 1195 Fitchville River Rd
- 38 Pleasant St
- 3846 Zenobia Rd
- 6175 U S 20
- 29 Stony Brook Ln
- V/L State Route 18
- 0 Stony Brook Ln
- 22 E Main St
- 42 Stony Brook Ln
- V/L 260 Stony Brook Ln
- 27 Deer Run Dr
- 5 Foxwood Cir
- 6084 Zenobia Rd
- 6080 Zenobia Rd
- 2215 Chenango Rd
- 6039 Zenobia Rd
- 6039 Zenobia Rd
- 6088 Zenobia Rd
- 2217 Chenango Rd
- 2088 Chenango Rd
- 6173 Zenobia Rd
- 2240 Chenango Rd
- 6192 Zenobia Rd
- 2046 Chenango Rd
- 2275 Chenango Rd
- 6183 Zenobia Rd
- 5936 Zenobia Rd
- 2024 Chenango Rd
- 5940 Zenobia Rd
- 6222 Zenobia Rd
- 2329 Chenango Rd
- 1961 Chenango Rd
Your Personal Tour Guide
Ask me questions while you tour the home.