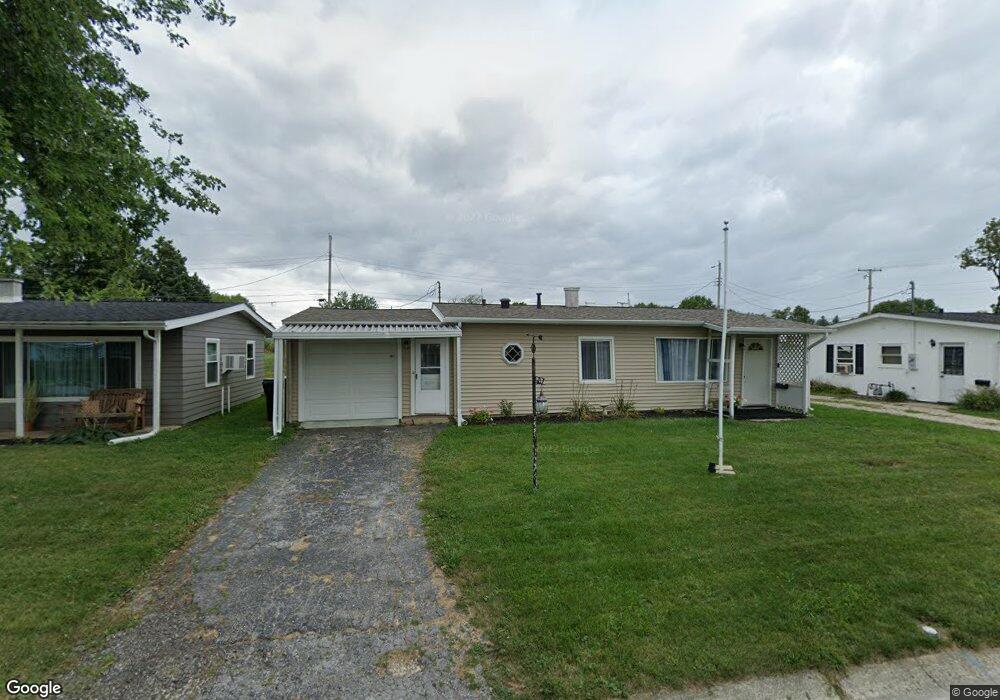
2150 Green Meadow Ln Huntington, IN 46750
Estimated Value: $99,000 - $160,000
3
Beds
1
Bath
768
Sq Ft
$158/Sq Ft
Est. Value
About This Home
This home is located at 2150 Green Meadow Ln, Huntington, IN 46750 and is currently estimated at $121,290, approximately $157 per square foot. 2150 Green Meadow Ln is a home located in Huntington County with nearby schools including Flint Springs Elementary School, Crestview Middle School, and Huntington North High School.
Ownership History
Date
Name
Owned For
Owner Type
Purchase Details
Closed on
Sep 4, 2022
Sold by
Roth Mathew J and Roth Laura D
Bought by
Party Of Five Llc
Current Estimated Value
Purchase Details
Closed on
Oct 23, 2018
Sold by
Party Of 5 Llc
Bought by
Roth Mathew J and Roth Laura D
Purchase Details
Closed on
Feb 28, 2018
Sold by
Roth Mathew J and Roth Laura D
Bought by
Party Of 5 Llc
Purchase Details
Closed on
Oct 24, 2017
Sold by
Selene Finance Limited Partnership and Bates Dianna L
Bought by
Roth Mathew J and Roth Laura D
Purchase Details
Closed on
Oct 29, 2007
Sold by
Hughes Jack J and Hughes Linda L
Bought by
Bates Jerry W and Bates Dianna L
Home Financials for this Owner
Home Financials are based on the most recent Mortgage that was taken out on this home.
Original Mortgage
$59,073
Interest Rate
6.44%
Mortgage Type
FHA
Create a Home Valuation Report for This Property
The Home Valuation Report is an in-depth analysis detailing your home's value as well as a comparison with similar homes in the area
Home Values in the Area
Average Home Value in this Area
Purchase History
| Date | Buyer | Sale Price | Title Company |
|---|---|---|---|
| Party Of Five Llc | -- | None Listed On Document | |
| Roth Mathew J | -- | -- | |
| Party Of 5 Llc | -- | -- | |
| Roth Mathew J | -- | None Available | |
| Bates Jerry W | -- | None Available |
Source: Public Records
Mortgage History
| Date | Status | Borrower | Loan Amount |
|---|---|---|---|
| Previous Owner | Bates Jerry W | $59,073 |
Source: Public Records
Tax History Compared to Growth
Tax History
| Year | Tax Paid | Tax Assessment Tax Assessment Total Assessment is a certain percentage of the fair market value that is determined by local assessors to be the total taxable value of land and additions on the property. | Land | Improvement |
|---|---|---|---|---|
| 2024 | $1,473 | $73,500 | $9,400 | $64,100 |
| 2023 | $1,473 | $73,500 | $9,400 | $64,100 |
| 2022 | $1,325 | $66,100 | $9,400 | $56,700 |
| 2021 | $1,092 | $54,500 | $9,400 | $45,100 |
| 2020 | $1,092 | $54,500 | $9,400 | $45,100 |
| 2019 | $992 | $49,500 | $9,400 | $40,100 |
| 2018 | $958 | $47,800 | $9,400 | $38,400 |
| 2017 | $536 | $47,600 | $9,400 | $38,200 |
| 2016 | $318 | $44,600 | $10,100 | $34,500 |
| 2014 | $287 | $42,700 | $10,100 | $32,600 |
| 2013 | $287 | $44,700 | $10,100 | $34,600 |
Source: Public Records
Map
Nearby Homes
- 420 Himes St
- 826 Himes St
- 612 Opal St
- 735 Ruth St
- 303 Home St
- 615 North St
- 1865 College Ave
- 1726 Guilford St
- TBD 200 North St
- 1756 Cherry St
- 1550 Byron St
- 1535 Byron St
- 1504 N Jefferson St
- 1433 Poplar St
- 807 Kintz St
- 636 Division St
- 1420 Byron St
- 101 Mccarty St
- 3100 Cumberland Way
- 1301 N Lafontaine St
- 2140 Green Meadow Ln
- 2160 Green Meadow Ln
- 2130 Green Meadow Ln
- 2170 Green Meadow Ln
- 2165 Green Meadow Ln
- 2120 Green Meadow Ln
- 2155 Green Meadow Ln
- 2135 Green Meadow Ln
- 2125 Green Meadow Ln
- 2110 Green Meadow Ln
- 2115 Green Meadow Ln
- 2105 Green Meadow Ln
- 2121 Guilford St
- 370 Himes St
- 350 Himes St
- 404 Himes St
- 414 Himes St
- 235 Dieringer Dr
- 2105 Guilford St
- 2150 Guilford St