21500 Harborside Blvd Port Charlotte, FL 33952
Estimated Value: $1,648,000 - $6,249,676
--
Bed
4
Baths
3,360
Sq Ft
$1,175/Sq Ft
Est. Value
About This Home
This home is located at 21500 Harborside Blvd, Port Charlotte, FL 33952 and is currently estimated at $3,948,838, approximately $1,175 per square foot. 21500 Harborside Blvd is a home located in Charlotte County with nearby schools including Peace River Elementary School, Port Charlotte Middle School, and Charlotte High School.
Ownership History
Date
Name
Owned For
Owner Type
Purchase Details
Closed on
Feb 29, 2016
Sold by
The Internal Improvement Trust Fund Of T
Bought by
Mungan Kenneth P
Current Estimated Value
Purchase Details
Closed on
Feb 28, 2013
Sold by
Bac Home Loans Servicing Lp
Bought by
Dec Mungan Kenneth P
Purchase Details
Closed on
Nov 18, 2010
Sold by
Koza John and Koza Diane C
Bought by
Bac Home Loans Servicing Lp
Purchase Details
Closed on
Oct 31, 2006
Sold by
Forefront Construction
Bought by
Koza John and Koza Diane
Home Financials for this Owner
Home Financials are based on the most recent Mortgage that was taken out on this home.
Original Mortgage
$1,725,000
Interest Rate
6.37%
Mortgage Type
Construction
Purchase Details
Closed on
Jan 22, 2006
Sold by
Jbsun Llc
Bought by
Mullen Timothy S
Purchase Details
Closed on
Jul 29, 1999
Sold by
Transland Inc
Bought by
Sunfish Inc
Create a Home Valuation Report for This Property
The Home Valuation Report is an in-depth analysis detailing your home's value as well as a comparison with similar homes in the area
Home Values in the Area
Average Home Value in this Area
Purchase History
| Date | Buyer | Sale Price | Title Company |
|---|---|---|---|
| Mungan Kenneth P | $185,600 | Attorney | |
| Dec Mungan Kenneth P | $310,000 | Gulf Cities Title Inc | |
| Bac Home Loans Servicing Lp | $1,587,000 | Attorney | |
| Koza John | -- | West Coast Abstract & Title | |
| Dailey Builders | $1,300,000 | West Coast Abstract & Title | |
| Mullen Timothy S | $1,100,000 | None Available | |
| Sunfish Inc | $350,000 | -- |
Source: Public Records
Mortgage History
| Date | Status | Borrower | Loan Amount |
|---|---|---|---|
| Previous Owner | Koza John | $1,725,000 |
Source: Public Records
Tax History Compared to Growth
Tax History
| Year | Tax Paid | Tax Assessment Tax Assessment Total Assessment is a certain percentage of the fair market value that is determined by local assessors to be the total taxable value of land and additions on the property. | Land | Improvement |
|---|---|---|---|---|
| 2024 | $49,828 | $3,069,387 | $1,896,350 | $1,173,037 |
| 2023 | $49,828 | $3,087,884 | $1,899,155 | $1,188,729 |
| 2022 | $53,753 | $3,318,154 | $1,899,155 | $1,418,999 |
| 2021 | $51,880 | $3,075,306 | $1,740,588 | $1,334,718 |
| 2020 | $31,689 | $1,858,173 | $1,740,588 | $117,585 |
| 2019 | $31,948 | $1,862,182 | $1,740,588 | $121,594 |
| 2018 | $28,136 | $1,748,221 | $1,648,575 | $99,646 |
| 2017 | $24,447 | $1,452,200 | $1,432,260 | $19,940 |
| 2016 | $23,717 | $1,379,940 | $0 | $0 |
| 2015 | $24,132 | $1,379,940 | $0 | $0 |
| 2014 | $9,035 | $516,928 | $0 | $0 |
Source: Public Records
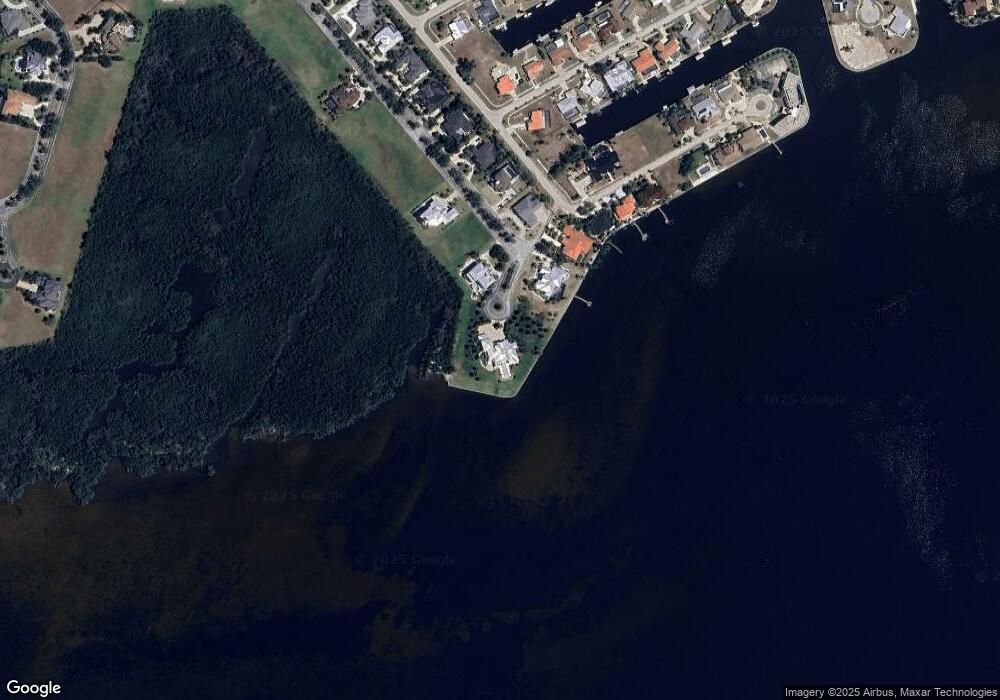
Map
Nearby Homes
- 21421 Harborside Blvd
- 250 George Rd SE
- 262 Fry Terrace SE
- 202 Tait Terrace SE
- 21370 Harborside Blvd
- 21361 Harborside Blvd
- 4661 Grassy Point Blvd
- 266 Beeney Rd SE
- 258 Beeney Rd SE
- 21321 Harborside Blvd
- 259 Fields Terrace SE
- 234 Fields Terrace SE
- 234 Beeney Rd SE
- 4630 Grassy Point Blvd
- 266 Bangsberg Rd SE
- 250 Bangsberg Rd SE
- 242 Bangsberg Rd SE
- 150 Cousley Dr SE
- 234 Bangsberg Rd SE
- 4471 Grassy Point Blvd
- 21490 Harborside Blvd
- 21470 Harborside Blvd
- 21481 Harborside Blvd
- 21441 Harborside Blvd
- 21460 Harborside Blvd
- 21450 Harborside Blvd
- 21431 Harborside Blvd
- 203 George Rd SE
- 21440 Harborside Blvd Unit 56
- 215 George Rd SE
- 202 George Rd SE
- 21430 Harborside Blvd
- 227 George Rd SE
- 21411 Harborside Blvd
- 21420 Harborside Blvd
- 178 Cousley Dr SE
- 226 George Rd SE
- 202 Fry Terrace SE
- 215 Fry Terrace SE
- 238 George Rd SE