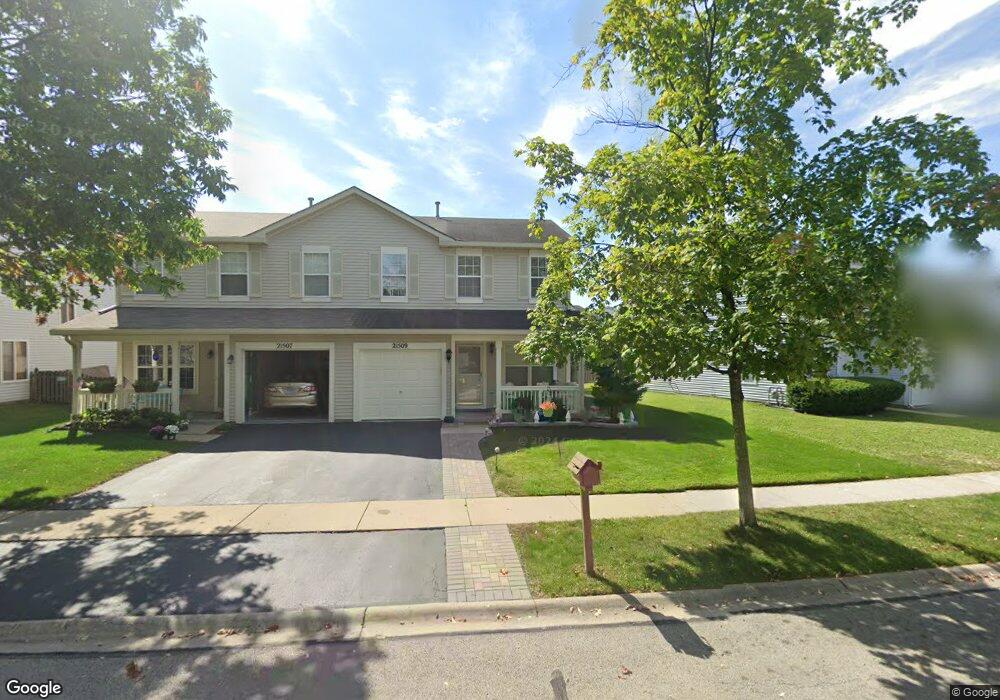
21509 Franklin Cir Unit 2 Plainfield, IL 60544
Lakewood Falls NeighborhoodEstimated Value: $266,000 - $285,000
2
Beds
3
Baths
1,325
Sq Ft
$207/Sq Ft
Est. Value
About This Home
This home is located at 21509 Franklin Cir Unit 2, Plainfield, IL 60544 and is currently estimated at $274,555, approximately $207 per square foot. 21509 Franklin Cir Unit 2 is a home located in Will County with nearby schools including Skoff Elementary School, A. Vito Martinez Middle School, and Romeoville High School.
Ownership History
Date
Name
Owned For
Owner Type
Purchase Details
Closed on
Dec 29, 2015
Sold by
Sundberg Burns Mary Lou
Bought by
Zhanay Romulo
Current Estimated Value
Home Financials for this Owner
Home Financials are based on the most recent Mortgage that was taken out on this home.
Original Mortgage
$126,663
Outstanding Balance
$102,163
Interest Rate
4.4%
Mortgage Type
FHA
Estimated Equity
$172,392
Purchase Details
Closed on
Feb 15, 2007
Sold by
Boyer Carolyn Sue
Bought by
Sundberg Mary Lou
Home Financials for this Owner
Home Financials are based on the most recent Mortgage that was taken out on this home.
Original Mortgage
$87,312
Interest Rate
8.99%
Mortgage Type
Purchase Money Mortgage
Purchase Details
Closed on
Jul 6, 1999
Sold by
Lakewood Falls Lp Phase 4
Bought by
Boyer Carolyn Sue
Home Financials for this Owner
Home Financials are based on the most recent Mortgage that was taken out on this home.
Original Mortgage
$92,500
Interest Rate
7.5%
Create a Home Valuation Report for This Property
The Home Valuation Report is an in-depth analysis detailing your home's value as well as a comparison with similar homes in the area
Home Values in the Area
Average Home Value in this Area
Purchase History
| Date | Buyer | Sale Price | Title Company |
|---|---|---|---|
| Zhanay Romulo | $129,000 | Attorney | |
| Sundberg Mary Lou | $159,000 | None Available | |
| Boyer Carolyn Sue | $116,000 | Chicago Title Insurance Co |
Source: Public Records
Mortgage History
| Date | Status | Borrower | Loan Amount |
|---|---|---|---|
| Open | Zhanay Romulo | $126,663 | |
| Previous Owner | Sundberg Mary Lou | $87,312 | |
| Previous Owner | Boyer Carolyn Sue | $92,500 |
Source: Public Records
Tax History
| Year | Tax Paid | Tax Assessment Tax Assessment Total Assessment is a certain percentage of the fair market value that is determined by local assessors to be the total taxable value of land and additions on the property. | Land | Improvement |
|---|---|---|---|---|
| 2024 | $6,095 | $73,736 | $22,844 | $50,892 |
| 2023 | $6,095 | $66,196 | $20,508 | $45,688 |
| 2022 | $5,359 | $59,940 | $18,570 | $41,370 |
| 2021 | $5,099 | $56,329 | $17,451 | $38,878 |
| 2020 | $4,957 | $54,477 | $16,877 | $37,600 |
| 2019 | $4,687 | $51,637 | $15,997 | $35,640 |
| 2018 | $4,256 | $46,870 | $14,520 | $32,350 |
| 2017 | $3,993 | $44,246 | $13,707 | $30,539 |
| 2016 | $3,759 | $41,467 | $12,846 | $28,621 |
| 2015 | $3,500 | $38,306 | $11,867 | $26,439 |
| 2014 | $3,500 | $37,190 | $11,521 | $25,669 |
| 2013 | $3,500 | $38,740 | $12,001 | $26,739 |
Source: Public Records
Map
Nearby Homes
- 21508 Franklin Cir
- 21423 Frost Ct
- 21459 W Georgetown Dr
- 21341 Earhart Ct
- 13744 S Ironwood Dr
- 1594 Arborwood Cir
- 13833 S Balsam Ln Unit D
- 13834 S Bristlecone Dr Unit D
- 14051 Danbury Dr
- 21721 W Empress Ln
- 14032 Danbury Dr
- 13809 S Bristlecone Dr Unit A
- 21728 W Empress Ln
- 13806 S Hickory Ln
- 21539 W Empress Ln
- 14153 S Longview Ln
- 21050 W Aspen Ln
- 21020 W Ardmore Cir
- 1819 Lake Shore Dr Unit 1
- 21854 W Kentwood Dr
- 21509 Franklin Cir
- 21507 Franklin Cir
- 21511 Franklin Cir
- 21513 Franklin Cir
- 21505 Franklin Cir
- 21503 Franklin Cir
- 21515 Franklin Cir
- 14114 Faulkner Ct
- 14112 Faulkner Ct
- 14112 Faulkner Ct Unit 1
- 21517 Franklin Cir
- 14116 Faulkner Ct
- 21510 Franklin Cir
- 14110 Faulkner Ct
- 21506 Franklin Cir Unit 2150
- 21459 Franklin Cir
- 21519 Franklin Cir
- 21504 Franklin Cir
- 21512 Franklin Cir
- 14118 Faulkner Ct Unit 10
Your Personal Tour Guide
Ask me questions while you tour the home.