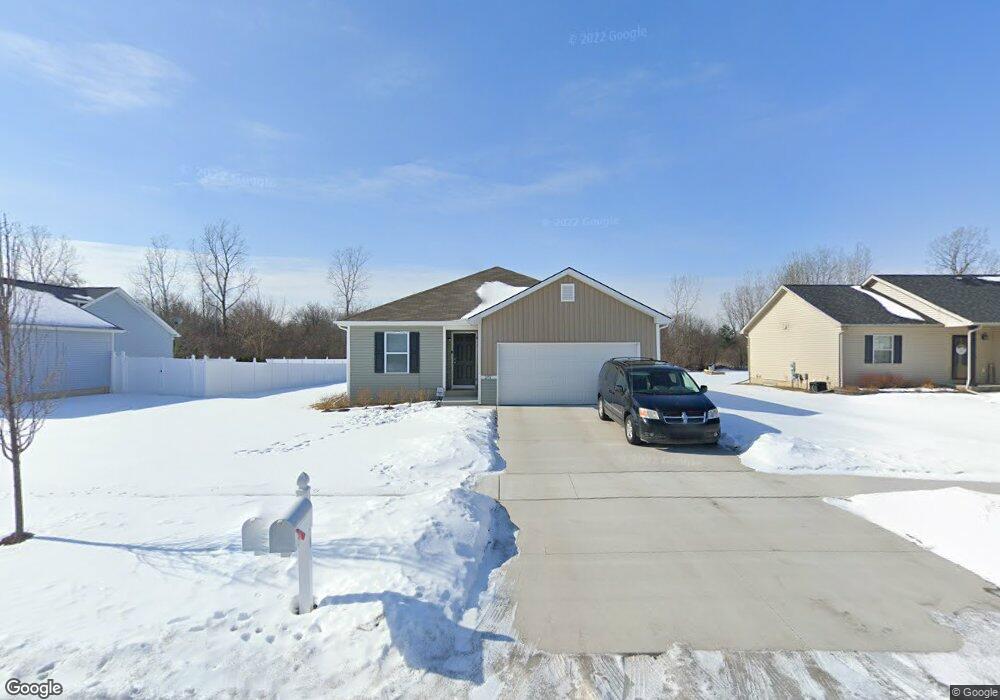
2151 Brier Crest Dr Davison, MI 48423
Estimated Value: $277,029 - $306,000
4
Beds
2
Baths
1,400
Sq Ft
$209/Sq Ft
Est. Value
About This Home
This home is located at 2151 Brier Crest Dr, Davison, MI 48423 and is currently estimated at $293,257, approximately $209 per square foot. 2151 Brier Crest Dr is a home located in Genesee County with nearby schools including Thomson Elementary School, Hill Elementary School, and Gates Elementary School.
Ownership History
Date
Name
Owned For
Owner Type
Purchase Details
Closed on
Oct 29, 2020
Sold by
Wjh Llc
Bought by
Demeniuk Eric M
Current Estimated Value
Home Financials for this Owner
Home Financials are based on the most recent Mortgage that was taken out on this home.
Original Mortgage
$205,545
Outstanding Balance
$182,069
Interest Rate
2.8%
Mortgage Type
New Conventional
Estimated Equity
$111,188
Purchase Details
Closed on
Mar 11, 2020
Sold by
North Oakland Management Company Inc
Bought by
Wjh Llc
Purchase Details
Closed on
May 31, 2013
Sold by
Tri County Bank
Bought by
North Oakland Management Company Inc
Purchase Details
Closed on
Nov 13, 2008
Sold by
Brier Crest & Associates Llc
Bought by
Tri County Bank
Purchase Details
Closed on
Apr 4, 2008
Sold by
Brier Crest & Associates Llc
Bought by
Tri County Bank
Purchase Details
Closed on
Mar 28, 2008
Sold by
Brier Crest & Associates Llc
Bought by
Tri County Bank
Create a Home Valuation Report for This Property
The Home Valuation Report is an in-depth analysis detailing your home's value as well as a comparison with similar homes in the area
Home Values in the Area
Average Home Value in this Area
Purchase History
| Date | Buyer | Sale Price | Title Company |
|---|---|---|---|
| Demeniuk Eric M | $203,490 | First American Title Ins Co | |
| Wjh Llc | -- | First American Title | |
| North Oakland Management Company Inc | $160,000 | Huron Title | |
| Tri County Bank | -- | None Available | |
| Tri County Bank | $1,929,078 | None Available | |
| Tri County Bank | $404,193 | None Available |
Source: Public Records
Mortgage History
| Date | Status | Borrower | Loan Amount |
|---|---|---|---|
| Open | Demeniuk Eric M | $205,545 |
Source: Public Records
Tax History
| Year | Tax Paid | Tax Assessment Tax Assessment Total Assessment is a certain percentage of the fair market value that is determined by local assessors to be the total taxable value of land and additions on the property. | Land | Improvement |
|---|---|---|---|---|
| 2025 | $4,037 | $133,100 | $0 | $0 |
| 2024 | $1,232 | $113,800 | $0 | $0 |
| 2023 | $1,176 | $106,400 | $0 | $0 |
| 2022 | $3,683 | $97,300 | $0 | $0 |
| 2021 | $3,669 | $95,800 | $0 | $0 |
| 2020 | $36 | $16,300 | $0 | $0 |
| 2019 | $36 | $15,000 | $0 | $0 |
| 2018 | $280 | $13,500 | $0 | $0 |
| 2017 | $278 | $13,500 | $0 | $0 |
| 2016 | $280 | $13,500 | $0 | $0 |
| 2015 | -- | $13,500 | $0 | $0 |
| 2012 | -- | $6,000 | $6,000 | $0 |
Source: Public Records
Map
Nearby Homes
- 9086 Spring Brook Cir Unit 51
- 9216 Davison Rd
- 8486 Oak Cliff Blvd Unit 48
- 502 Gary Ray Dr
- 2089 W Ridge Dr Unit 12
- 923 Village
- 927 Village Dr
- 726 W 2nd St
- 625 Charles St
- 511 Garland St
- 7040 N Oak Rd
- 2239 Baltimore Ln
- 2323 Baltimore
- 7120 N Oak Rd
- 00 Richfield Rd E
- 2367 Baltimore
- 7165 Donegal
- 2339 Clifden
- 2247 Baltimore Ln
- 0 N Washburn Rd Vacant Land Unit 20261005623
- 2150 Brier Crest Dr
- 2166 Brier Crest Dr
- 2126 Brier Crest Dr
- 2142 Brier Crest Dr
- 2116 Brier Crest Dr
- 2134 Brier Crest Dr
- 2159 Brier Crest Dr
- 2158 Brier Crest Dr
- 2145 Brier Crest Dr
- 2139 Brier Crest Dr
- 2133 Brier Crest Dr
- 2127 Brier Crest Dr
- 9128 Magnolia Ct
- 9127 Magnolia Ct
- 2104 Brier Crest Dr
- 2121 Brier Crest Dr
- 9311 Magnolia
- 9139 Magnolia
- 9115 Magnolia
- 9123 Magnolia
Your Personal Tour Guide
Ask me questions while you tour the home.