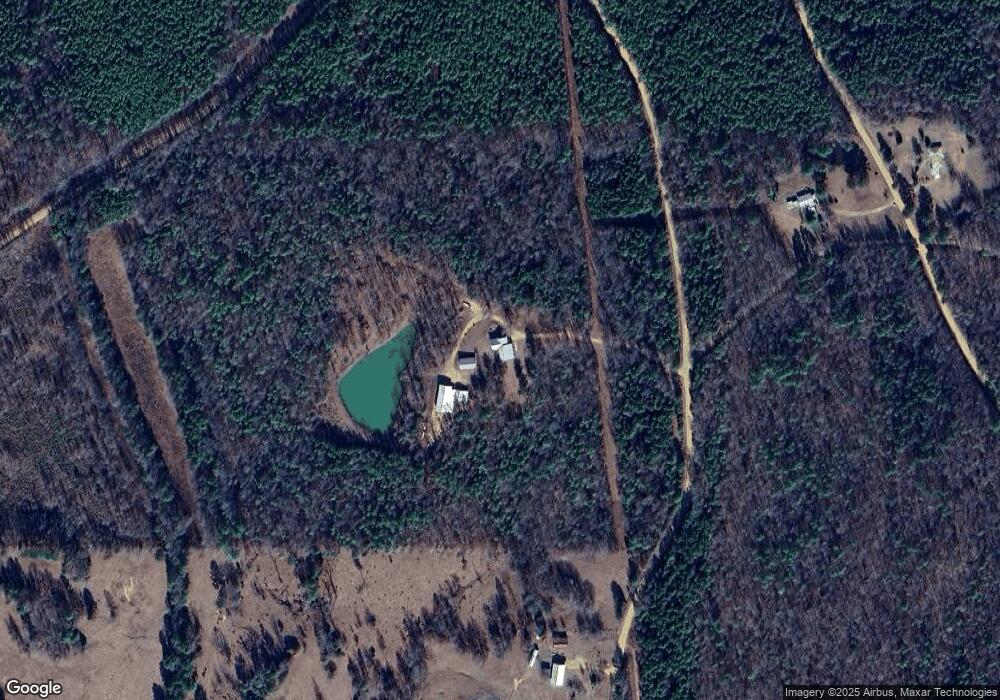
2151 Hoss Johnson Rd Mantee, MS 39751
Estimated Value: $123,000 - $373,260
4
Beds
--
Bath
2,617
Sq Ft
$93/Sq Ft
Est. Value
About This Home
This home is located at 2151 Hoss Johnson Rd, Mantee, MS 39751 and is currently estimated at $242,315, approximately $92 per square foot. 2151 Hoss Johnson Rd is a home located in Clay County with nearby schools including West Clay Elementary School, East Side Elementary School, and Church Hill Elementary School.
Create a Home Valuation Report for This Property
The Home Valuation Report is an in-depth analysis detailing your home's value as well as a comparison with similar homes in the area
Tax History
| Year | Tax Paid | Tax Assessment Tax Assessment Total Assessment is a certain percentage of the fair market value that is determined by local assessors to be the total taxable value of land and additions on the property. | Land | Improvement |
|---|---|---|---|---|
| 2025 | $1,617 | $31,139 | $1,138 | $30,001 |
| 2024 | $1,617 | $31,431 | $1,138 | $30,293 |
| 2023 | $2,683 | $26,877 | $1,138 | $25,739 |
| 2022 | $1,388 | $27,620 | $1,138 | $26,482 |
| 2021 | $1,385 | $27,620 | $1,138 | $26,482 |
| 2020 | $1,393 | $27,620 | $1,138 | $26,482 |
| 2019 | $1,281 | $27,376 | $1,138 | $26,238 |
| 2018 | $1,043 | $23,749 | $988 | $22,761 |
| 2017 | $1,043 | $23,749 | $988 | $22,761 |
| 2016 | $1,029 | $23,899 | $1,138 | $22,761 |
| 2015 | $613 | $14,967 | $1,138 | $13,829 |
| 2014 | $1,311 | $14,967 | $1,138 | $13,829 |
| 2013 | $1,311 | $14,967 | $1,138 | $13,829 |
Source: Public Records
Map
Nearby Homes
- 19114 Mississippi 46
- 140 Pate Rd
- 12386 Mississippi 15
- 10733 Mississippi 15
- 12766 Mississippi 15
- 0 Mississippi 46 Unit 25-1215
- Ms-46
- 202 Main St
- 0 Mantee Rd
- 1492 Berry Rd
- 964 Hugh Mosley Rd
- 1564 Berry Rd
- Ms-389
- 111 Wild Plum Rd
- 0 Jackson Rd ( Cr263) Unit 25-1630
- 98 Whitetail Dr
- 364 County Road 80
- 351 Quail Hollow Ln
- 348 Quail Hollow Ln
- 4 Hohenlinden Rd
Your Personal Tour Guide
Ask me questions while you tour the home.