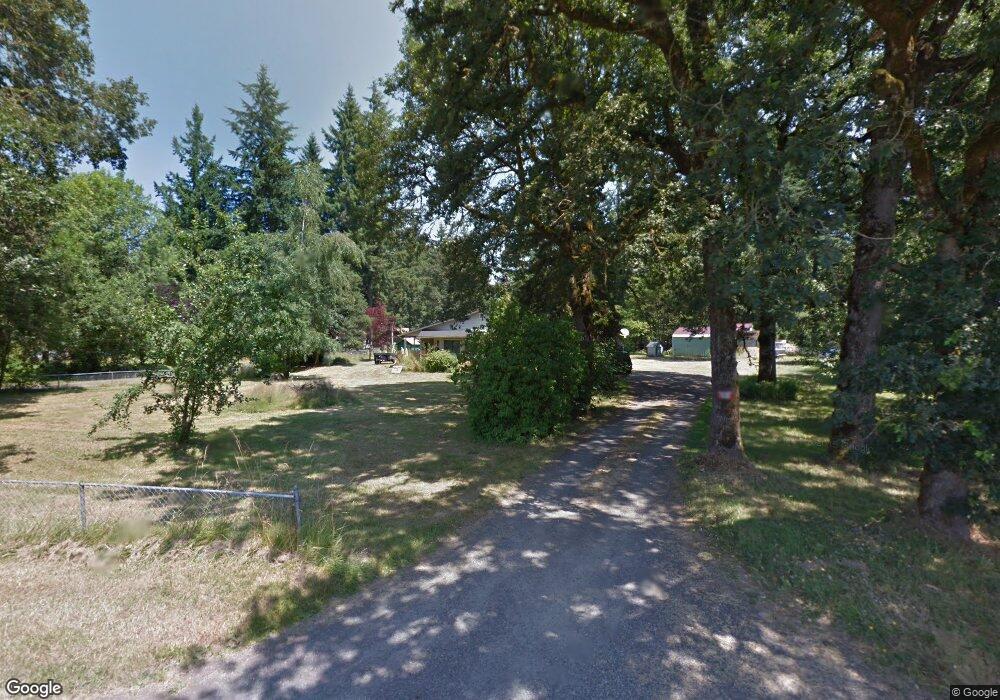
21511 NE 67th Ave Battle Ground, WA 98604
Estimated Value: $488,000 - $564,000
3
Beds
1
Bath
1,485
Sq Ft
$353/Sq Ft
Est. Value
About This Home
This home is located at 21511 NE 67th Ave, Battle Ground, WA 98604 and is currently estimated at $524,660, approximately $353 per square foot. 21511 NE 67th Ave is a home located in Clark County with nearby schools including Pleasant Valley Primary School, Pleasant Valley Middle School, and Prairie High School.
Ownership History
Date
Name
Owned For
Owner Type
Purchase Details
Closed on
Dec 13, 2011
Sold by
Jp Morgan Chase Bank Na
Bought by
Anderson Cheryl M
Current Estimated Value
Purchase Details
Closed on
Oct 12, 2011
Sold by
Federal National Mortgage Association
Bought by
Jp Morgan Chase Bank Na
Purchase Details
Closed on
Jul 20, 2011
Sold by
Cash Hector M
Bought by
Federal National Mortgage Association
Purchase Details
Closed on
Feb 26, 2007
Sold by
Silverland Properties
Bought by
Cash Hector M
Home Financials for this Owner
Home Financials are based on the most recent Mortgage that was taken out on this home.
Original Mortgage
$39,885
Interest Rate
6.23%
Mortgage Type
Credit Line Revolving
Purchase Details
Closed on
May 18, 2006
Sold by
Uhacz Leonard M and Uhacz Beverly A
Bought by
Silverland Properties Llc
Home Financials for this Owner
Home Financials are based on the most recent Mortgage that was taken out on this home.
Original Mortgage
$168,750
Interest Rate
6.55%
Mortgage Type
Purchase Money Mortgage
Create a Home Valuation Report for This Property
The Home Valuation Report is an in-depth analysis detailing your home's value as well as a comparison with similar homes in the area
Home Values in the Area
Average Home Value in this Area
Purchase History
| Date | Buyer | Sale Price | Title Company |
|---|---|---|---|
| Anderson Cheryl M | $118,000 | Chicago Title Insurance | |
| Jp Morgan Chase Bank Na | -- | First American | |
| Federal National Mortgage Association | $255,031 | First American Title | |
| Cash Hector M | $265,900 | Columbia Title Agency | |
| Silverland Properties Llc | $179,000 | Columbia Title Agency |
Source: Public Records
Mortgage History
| Date | Status | Borrower | Loan Amount |
|---|---|---|---|
| Previous Owner | Cash Hector M | $39,885 | |
| Previous Owner | Cash Hector M | $212,400 | |
| Previous Owner | Silverland Properties Llc | $168,750 |
Source: Public Records
Tax History Compared to Growth
Tax History
| Year | Tax Paid | Tax Assessment Tax Assessment Total Assessment is a certain percentage of the fair market value that is determined by local assessors to be the total taxable value of land and additions on the property. | Land | Improvement |
|---|---|---|---|---|
| 2025 | $3,951 | $467,240 | $235,800 | $231,440 |
| 2024 | $3,684 | $445,931 | $235,800 | $210,131 |
| 2023 | $3,583 | $466,929 | $240,000 | $226,929 |
| 2022 | $3,500 | $415,322 | $194,800 | $220,522 |
| 2021 | $3,283 | $376,790 | $190,000 | $186,790 |
| 2020 | $3,310 | $322,833 | $166,000 | $156,833 |
| 2019 | $2,740 | $319,306 | $168,400 | $150,906 |
| 2018 | $3,338 | $301,986 | $0 | $0 |
| 2017 | $2,493 | $281,970 | $0 | $0 |
| 2016 | $2,420 | $227,471 | $0 | $0 |
| 2015 | $2,373 | $203,407 | $0 | $0 |
| 2014 | -- | $189,956 | $0 | $0 |
| 2013 | -- | $167,209 | $0 | $0 |
Source: Public Records
Map
Nearby Homes
- 5610 NE 199th St
- 23422 NE 72nd Ave
- 23001 NE 82nd Ave
- 20504 NE 40th Ave
- 23403 NE 92nd Ave
- 23615 NE 92nd Ave
- 19609 NE 35th Ct
- 151 NW 30th Ave
- 4210 NE 188th St Unit LOT 329
- 4202 NE 188th St Unit LOT 327
- 18502 NE 45th Ave Unit LOT 362
- 344 NW 29th Way
- 18503 NE 44th Ave Unit LOT 365
- 4224 NE 186th St Unit LOT 251
- 4216 NE 186th St Unit LOT 249
- 6805 NE 179th St
- 4212 NE 186th St Unit LOT 248
- 4303 NE 186th St Unit LOT 259
- 8008 NE 179th St Unit 23
- 4308 NE 185th St
- 0 NE 216 Th Cir Unit 10046603
- 0 NE 216 Th Cir Unit 13 13228087
- 21417 NE 67th Ave
- 0 NE 216th Cir Unit 10046621
- 0 NE 216th Cir Unit 10046609
- 0 NE 216th Cir Unit 10044795
- 0 NE 216th Cir Unit 9087866
- 0 NE 216th Cir Unit 8045760
- 0 NE 216th Cir Unit 8045727
- 0 NE 216th Cir Unit 8048330
- 0 NE 216th Cir Unit 8048335
- 0 NE 216th Cir Unit 8048317
- 0 NE 216th Cir Unit 8050249
- 0 NE 216th Cir Unit 8050244
- 0 NE 216th Cir Unit 8050569
- 0 NE 216th Cir Unit 8050559
- 0 NE 216th Cir Unit 8053283
- 0 NE 216th Cir Unit 8053276
- 0 NE 216th Cir Unit 8053272
- 0 NE 216th Cir Unit 12 9010331