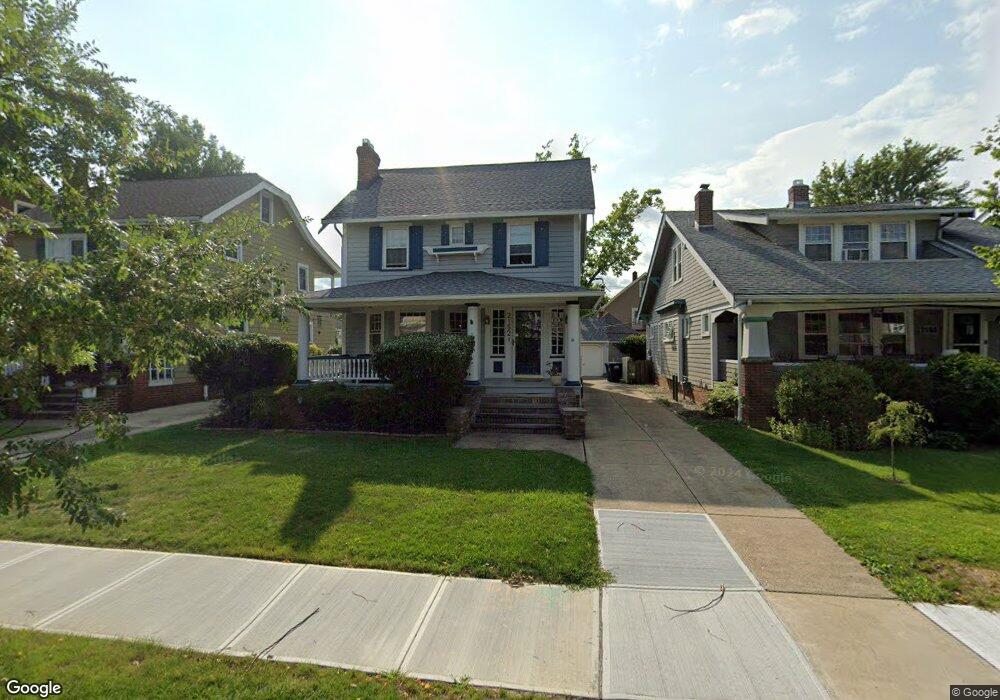
2152 Northland Ave Lakewood, OH 44107
Estimated Value: $316,000 - $349,000
3
Beds
1
Bath
1,568
Sq Ft
$214/Sq Ft
Est. Value
About This Home
This home is located at 2152 Northland Ave, Lakewood, OH 44107 and is currently estimated at $335,294, approximately $213 per square foot. 2152 Northland Ave is a home located in Cuyahoga County with nearby schools including Hayes Elementary School, Harding Middle School, and Lakewood High School.
Ownership History
Date
Name
Owned For
Owner Type
Purchase Details
Closed on
May 13, 2010
Sold by
Bye Ronald J and Ekleberry Judith M
Bought by
Schmidt Rachel H and Schmidt Jesse M
Current Estimated Value
Home Financials for this Owner
Home Financials are based on the most recent Mortgage that was taken out on this home.
Original Mortgage
$79,532
Outstanding Balance
$53,594
Interest Rate
5.16%
Mortgage Type
FHA
Estimated Equity
$281,700
Purchase Details
Closed on
Apr 25, 2001
Sold by
Bye Nancy Vogt
Bought by
Bye Ronald J
Home Financials for this Owner
Home Financials are based on the most recent Mortgage that was taken out on this home.
Original Mortgage
$92,000
Interest Rate
7.03%
Purchase Details
Closed on
Sep 19, 1989
Sold by
Kocian Nancy V
Bought by
Bye Nancy Vogt
Purchase Details
Closed on
Aug 6, 1982
Sold by
Kocian Jeffrey L and Kocian Nancy V
Bought by
Kocian Nancy
Purchase Details
Closed on
Jan 1, 1975
Bought by
Kocian Jeffrey L and Kocian Nancy
Create a Home Valuation Report for This Property
The Home Valuation Report is an in-depth analysis detailing your home's value as well as a comparison with similar homes in the area
Home Values in the Area
Average Home Value in this Area
Purchase History
| Date | Buyer | Sale Price | Title Company |
|---|---|---|---|
| Schmidt Rachel H | $81,000 | Newman Title | |
| Bye Ronald J | -- | Truetitle Agency Inc | |
| Bye Nancy Vogt | -- | -- | |
| Kocian Nancy | -- | -- | |
| Kocian Jeffrey L | -- | -- |
Source: Public Records
Mortgage History
| Date | Status | Borrower | Loan Amount |
|---|---|---|---|
| Open | Schmidt Rachel H | $79,532 | |
| Closed | Bye Ronald J | $92,000 |
Source: Public Records
Tax History Compared to Growth
Tax History
| Year | Tax Paid | Tax Assessment Tax Assessment Total Assessment is a certain percentage of the fair market value that is determined by local assessors to be the total taxable value of land and additions on the property. | Land | Improvement |
|---|---|---|---|---|
| 2024 | $6,101 | $94,990 | $17,780 | $77,210 |
| 2023 | $5,362 | $71,440 | $14,420 | $57,020 |
| 2022 | $5,396 | $71,440 | $14,420 | $57,020 |
| 2021 | $5,341 | $71,440 | $14,420 | $57,020 |
| 2020 | $4,737 | $55,370 | $11,170 | $44,210 |
| 2019 | $4,643 | $158,200 | $31,900 | $126,300 |
| 2018 | $4,636 | $55,370 | $11,170 | $44,210 |
| 2017 | $2,610 | $28,320 | $8,470 | $19,850 |
| 2016 | $2,592 | $28,320 | $8,470 | $19,850 |
| 2015 | $2,594 | $28,320 | $8,470 | $19,850 |
| 2014 | $2,594 | $27,240 | $8,160 | $19,080 |
Source: Public Records
Map
Nearby Homes
- 2209 Woodward Ave
- 2239 Woodward Ave
- 2223 Eldred Ave
- 2087 Lakeland Ave
- 2234 Olive Ave
- 1615 Wagar Ave
- 1617 Westwood Ave
- 15555 Hilliard Rd Unit 401A
- 2192 Glenbury Ave
- 1563 Wagar Ave
- 2165 Arthur Ave
- 1547 Orchard Grove Ave
- 1542 Westwood Ave
- 17322 Archdale Ave
- 2111 Overbrook Ave
- 1507 Orchard Grove Ave
- 1578 Mars Ave
- 14924 Arden Ave
- 14926 Esther Ave
- 1500 Lauderdale Ave
- 2148 Northland Ave
- 2156 Northland Ave
- 2144 Northland Ave
- 2160 Northland Ave
- 2140 Northland Ave
- 2164 Northland Ave
- 2151 Woodward Ave
- 2147 Woodward Ave
- 2153 Woodward Ave
- 2141 Woodward Ave
- 2155 Woodward Ave
- 2136 Northland Ave
- 2168 Northland Ave
- 2139 Woodward Ave
- 2153 Northland Ave
- 2149 Northland Ave
- 2157 Northland Ave
- 2145 Northland Ave
- 2161 Woodward Ave
- 2161 Northland Ave