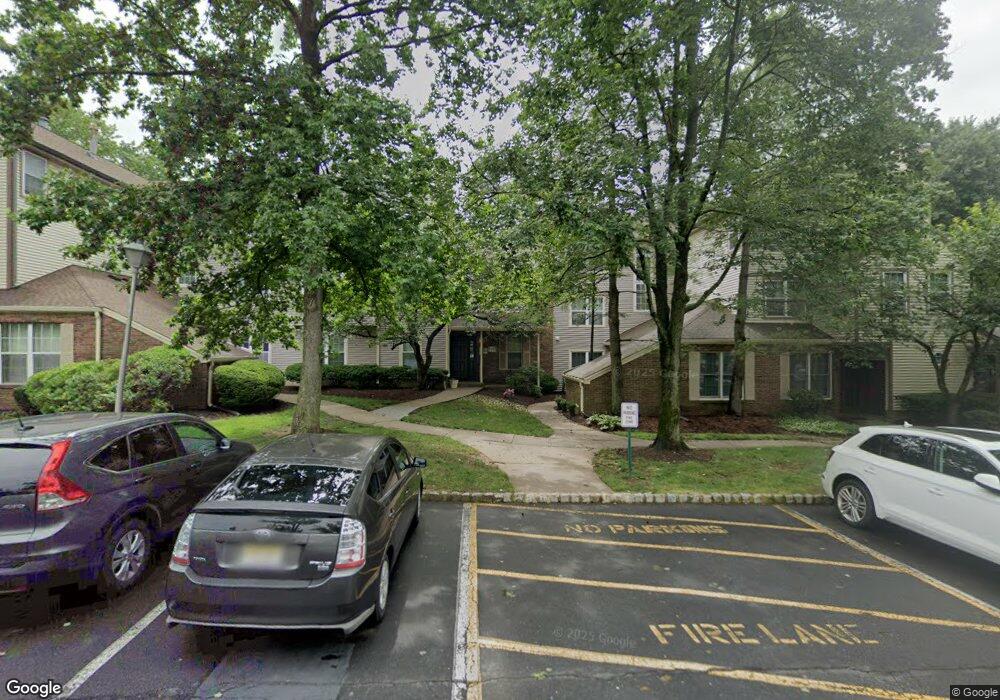
2153 Ash Ct Monmouth Junction, NJ 08852
Estimated Value: $362,387 - $401,000
2
Beds
2
Baths
1,160
Sq Ft
$326/Sq Ft
Est. Value
About This Home
This home is located at 2153 Ash Ct, Monmouth Junction, NJ 08852 and is currently estimated at $377,847, approximately $325 per square foot. 2153 Ash Ct is a home located in Middlesex County with nearby schools including Brooks Crossing Elementary School, Crossroads North Middle School, and South Brunswick High School.
Ownership History
Date
Name
Owned For
Owner Type
Purchase Details
Closed on
Aug 5, 2003
Sold by
Finder Scott
Bought by
Dibiasi Darrin
Current Estimated Value
Home Financials for this Owner
Home Financials are based on the most recent Mortgage that was taken out on this home.
Original Mortgage
$179,000
Interest Rate
6.31%
Purchase Details
Closed on
Nov 2, 2001
Sold by
Awadalla Mark
Bought by
Finder Scott and Finder Courtney
Home Financials for this Owner
Home Financials are based on the most recent Mortgage that was taken out on this home.
Original Mortgage
$135,357
Interest Rate
6.7%
Purchase Details
Closed on
Oct 7, 1999
Sold by
Zwerling M Cory
Bought by
Awadalla Mark
Home Financials for this Owner
Home Financials are based on the most recent Mortgage that was taken out on this home.
Original Mortgage
$86,850
Interest Rate
7.78%
Create a Home Valuation Report for This Property
The Home Valuation Report is an in-depth analysis detailing your home's value as well as a comparison with similar homes in the area
Home Values in the Area
Average Home Value in this Area
Purchase History
| Date | Buyer | Sale Price | Title Company |
|---|---|---|---|
| Dibiasi Darrin | $185,500 | -- | |
| Finder Scott | $131,415 | -- | |
| Awadalla Mark | $96,800 | -- |
Source: Public Records
Mortgage History
| Date | Status | Borrower | Loan Amount |
|---|---|---|---|
| Previous Owner | Dibiasi Darrin | $179,000 | |
| Previous Owner | Finder Scott | $135,357 | |
| Previous Owner | Awadalla Mark | $86,850 |
Source: Public Records
Tax History Compared to Growth
Tax History
| Year | Tax Paid | Tax Assessment Tax Assessment Total Assessment is a certain percentage of the fair market value that is determined by local assessors to be the total taxable value of land and additions on the property. | Land | Improvement |
|---|---|---|---|---|
| 2025 | $4,970 | $92,000 | $45,000 | $47,000 |
| 2024 | $4,791 | $92,000 | $45,000 | $47,000 |
| 2023 | $4,791 | $92,000 | $45,000 | $47,000 |
| 2022 | $4,649 | $92,000 | $45,000 | $47,000 |
| 2021 | $3,385 | $92,000 | $45,000 | $47,000 |
| 2020 | $4,677 | $92,000 | $45,000 | $47,000 |
| 2019 | $4,720 | $92,000 | $45,000 | $47,000 |
| 2018 | $4,565 | $92,000 | $45,000 | $47,000 |
| 2017 | $4,559 | $92,000 | $45,000 | $47,000 |
| 2016 | $4,511 | $92,000 | $45,000 | $47,000 |
| 2015 | $4,373 | $92,000 | $45,000 | $47,000 |
| 2014 | $4,302 | $92,000 | $45,000 | $47,000 |
Source: Public Records
Map
Nearby Homes
- 3011 Cypress Ct
- 3242 Cypress Ct Unit 3242
- 4031 Bayberry Ct
- 2002 Sandlewood Ct
- 206 Ash Ct
- 1312 Juniper Ct
- 1111 Hickory Ct
- 1106 Hickory Ct
- 7041 Elm Ct
- 5192 Beech Ct
- 6143 Cedar Ct
- 209 Gambocz Ct
- 61 Stouts Ln
- 32 Magnolia Ct
- 22 Witch Hazel Ct Unit 2
- 4 Donner Ct
- 6 Donner Ct
- 586 Ridge Rd
- 9 Kearns Place Unit 3805
- 3 Gramercy Rd