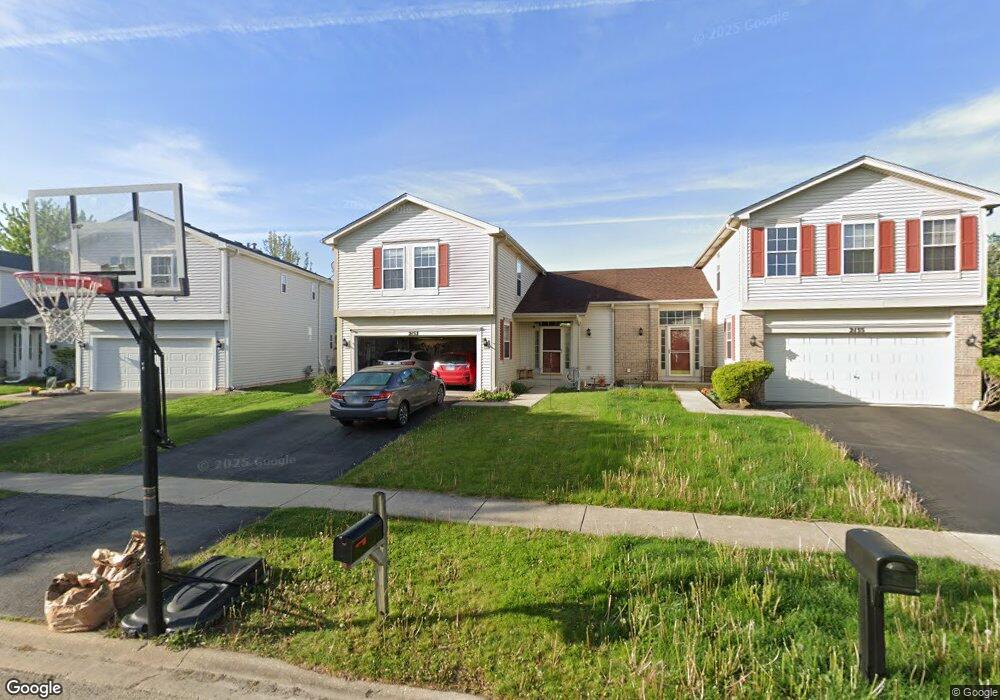
2153 Carpenter Ave Plainfield, IL 60586
North Minooka NeighborhoodEstimated Value: $266,000 - $302,000
Studio
1
Bath
1,299
Sq Ft
$216/Sq Ft
Est. Value
About This Home
This home is located at 2153 Carpenter Ave, Plainfield, IL 60586 and is currently estimated at $280,445, approximately $215 per square foot. 2153 Carpenter Ave is a home located in Kendall County with nearby schools including Charles Reed Elementary School, Drauden Point Middle School, and Plainfield South High School.
Ownership History
Date
Name
Owned For
Owner Type
Purchase Details
Closed on
May 4, 2022
Sold by
Mark Tomaszewski
Bought by
Carl Rudolph Shutting Carl Rudolph and Shutting Kayla Dawn
Current Estimated Value
Purchase Details
Closed on
Nov 17, 2006
Sold by
Bland Robert B and Bland Bernedette L
Bought by
Tomaszewski Mark T
Home Financials for this Owner
Home Financials are based on the most recent Mortgage that was taken out on this home.
Original Mortgage
$18,150
Interest Rate
8.25%
Mortgage Type
Credit Line Revolving
Purchase Details
Closed on
Mar 1, 1999
Sold by
Richard Smykal Inc
Bought by
Bland Robert B and Bland Bernadette L
Home Financials for this Owner
Home Financials are based on the most recent Mortgage that was taken out on this home.
Original Mortgage
$119,939
Interest Rate
6.78%
Mortgage Type
FHA
Create a Home Valuation Report for This Property
The Home Valuation Report is an in-depth analysis detailing your home's value as well as a comparison with similar homes in the area
Home Values in the Area
Average Home Value in this Area
Purchase History
| Date | Buyer | Sale Price | Title Company |
|---|---|---|---|
| Carl Rudolph Shutting Carl Rudolph | $38,000 | Fidelity National Title | |
| Tomaszewski Mark T | $181,500 | Chicago Title Insurance Co | |
| Bland Robert B | $125,000 | Chicago Title Insurance Co |
Source: Public Records
Mortgage History
| Date | Status | Borrower | Loan Amount |
|---|---|---|---|
| Previous Owner | Tomaszewski Mark T | $18,150 | |
| Previous Owner | Tomaszewski Mark T | $145,200 | |
| Previous Owner | Bland Robert B | $119,939 |
Source: Public Records
Tax History
| Year | Tax Paid | Tax Assessment Tax Assessment Total Assessment is a certain percentage of the fair market value that is determined by local assessors to be the total taxable value of land and additions on the property. | Land | Improvement |
|---|---|---|---|---|
| 2024 | $4,829 | $77,780 | $11,520 | $66,260 |
| 2023 | $5,278 | $71,810 | $9,000 | $62,810 |
| 2022 | $5,278 | $66,282 | $8,416 | $57,866 |
| 2021 | $4,772 | $58,629 | $8,295 | $50,334 |
| 2020 | $4,794 | $57,802 | $8,178 | $49,624 |
| 2019 | $4,756 | $56,381 | $7,977 | $48,404 |
| 2018 | $4,269 | $50,634 | $7,164 | $43,470 |
| 2017 | $4,149 | $46,031 | $6,513 | $39,518 |
| 2016 | $3,935 | $42,619 | $6,433 | $36,186 |
| 2015 | $4,138 | $42,618 | $6,105 | $36,513 |
| 2014 | -- | $37,315 | $6,105 | $31,210 |
| 2013 | -- | $37,315 | $6,105 | $31,210 |
Source: Public Records
Map
Nearby Homes
- 2031 Havenhill Dr
- 2126 Ingersoll Ct
- 2302 Covington Ct
- 2009 Ashbrook Ct Unit 3
- 2224 Ashby Ln
- 2017 Lilyana Ln
- 7013 Manchester Dr
- 7202 Faxton Ln
- 7514 Rosewind Dr Unit 2
- 7311 Fordham Ln
- 1702 Waterman Dr
- 1811 Cumberland Dr
- 2404 White Ash Ct
- 6709 Buchanan Cir
- 6710 Buchanan Cir
- 6707 Buchanan Cir
- 6708 Buchanan Cir
- 1812 Overland Dr
- 1800 Overland Dr
- 1803 Overland Dr
- 2151 Carpenter Ave
- 2155 Carpenter Ave
- 2149 Carpenter Ave
- 2158 Brayton Place Unit 4
- 2156 Brayton Place
- 2033 Havenhill Dr
- 2154 Brayton Place Unit 4
- 2035 Havenhill Dr
- 2150 Brayton Place
- 2150 Carpenter Ave
- 2150 Henning Place
- 2148 Carpenter Ave
- 2152 Carpenter Ave Unit 4
- 2029 Havenhill Dr
- 2149 Henning Place
- 2154 Carpenter Ave
- 2148 Brayton Place
- 2108 Langdon Cir
- 2151 Henning Place
- 2151 Henning Place Unit 2311
Your Personal Tour Guide
Ask me questions while you tour the home.