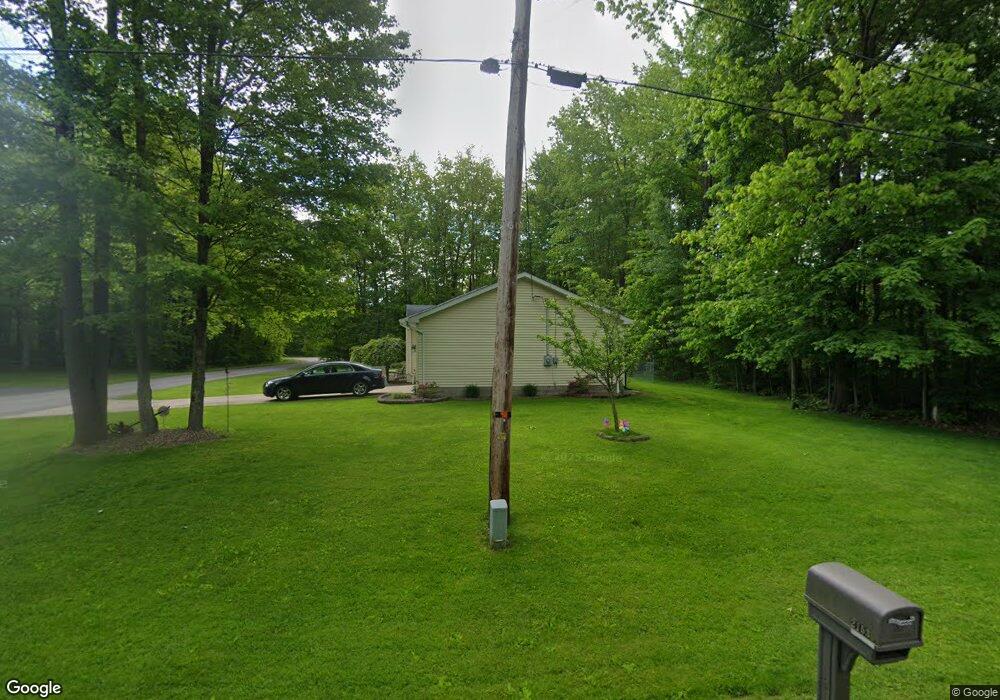
2153 Deer Run Roaming Shores, OH 44084
Estimated Value: $288,000 - $328,000
3
Beds
3
Baths
2,100
Sq Ft
$144/Sq Ft
Est. Value
About This Home
This home is located at 2153 Deer Run, Roaming Shores, OH 44084 and is currently estimated at $302,182, approximately $143 per square foot. 2153 Deer Run is a home located in Ashtabula County with nearby schools including Rock Creek Elementary School, Jefferson Area Junior High School, and Jefferson Area Senior High School.
Ownership History
Date
Name
Owned For
Owner Type
Purchase Details
Closed on
Jul 24, 2017
Sold by
Zirkle Charles L and Zirkle Joann M
Bought by
Zirkle Thomas G and Zirkle Gayle A
Current Estimated Value
Home Financials for this Owner
Home Financials are based on the most recent Mortgage that was taken out on this home.
Original Mortgage
$69,190
Interest Rate
3.89%
Mortgage Type
FHA
Purchase Details
Closed on
Aug 29, 2011
Sold by
Damico Dennis and Damico Sharon L
Bought by
Zirkle Charles L and Zirkle Joann M
Home Financials for this Owner
Home Financials are based on the most recent Mortgage that was taken out on this home.
Original Mortgage
$98,000
Interest Rate
4.58%
Mortgage Type
New Conventional
Purchase Details
Closed on
Aug 9, 2006
Sold by
Gwinn Brothers Construction Inc
Bought by
Damico Dennis and Damico Sharon L
Purchase Details
Closed on
Jun 17, 1996
Sold by
Auditor Brenda Perry Pr
Bought by
Gwinn Brothers Const Inc
Create a Home Valuation Report for This Property
The Home Valuation Report is an in-depth analysis detailing your home's value as well as a comparison with similar homes in the area
Home Values in the Area
Average Home Value in this Area
Purchase History
| Date | Buyer | Sale Price | Title Company |
|---|---|---|---|
| Zirkle Thomas G | $152,000 | Chicago Title | |
| Zirkle Charles L | $122,500 | Chicago Title | |
| Damico Dennis | $8,500 | Real Living Title Agency Ltd | |
| Gwinn Brothers Const Inc | $2,650 | -- |
Source: Public Records
Mortgage History
| Date | Status | Borrower | Loan Amount |
|---|---|---|---|
| Previous Owner | Zirkle Thomas G | $69,190 | |
| Previous Owner | Zirkle Charles L | $98,000 |
Source: Public Records
Tax History Compared to Growth
Tax History
| Year | Tax Paid | Tax Assessment Tax Assessment Total Assessment is a certain percentage of the fair market value that is determined by local assessors to be the total taxable value of land and additions on the property. | Land | Improvement |
|---|---|---|---|---|
| 2024 | $6,378 | $73,750 | $7,280 | $66,470 |
| 2023 | $3,388 | $73,750 | $7,280 | $66,470 |
| 2022 | $3,008 | $61,010 | $5,600 | $55,410 |
| 2021 | $3,038 | $61,010 | $5,600 | $55,410 |
| 2020 | $2,987 | $61,010 | $5,600 | $55,410 |
| 2019 | $2,640 | $53,210 | $3,750 | $49,460 |
| 2018 | $2,604 | $53,210 | $3,750 | $49,460 |
| 2017 | $2,653 | $53,210 | $3,750 | $49,460 |
| 2016 | $2,723 | $53,210 | $3,750 | $49,460 |
| 2015 | $2,704 | $53,210 | $3,750 | $49,460 |
| 2014 | $2,623 | $53,210 | $3,750 | $49,460 |
| 2013 | $1,968 | $42,880 | $3,010 | $39,870 |
Source: Public Records
Map
Nearby Homes
- 2127 Flame Lake Dr
- 2154 Flame Lake Dr
- 2191 Deer Run
- 2213 Fox Run Cir
- 2114 N Park Ln
- 2107 N Park Ln
- 2069 S Park Ln
- 2018 Flame Lake Dr
- 2074 S Park Ln
- 2073 S Park Ln
- 2455 Plum Creek
- 2335 Morning Star Dr
- 2488 Tupelo Dr
- 2498 Hayford Rd
- 62 Rockaway Dr
- 2514 Hayford Rd
- 664 Wren Cir
- 681&682 Rome Rock Creek Rd
- 683 Rome Rock Creek Rd
- 490 Peacock Ln
- 2150 Deer Run
- 2145 Deer Run
- 2151 Deer Run
- 2215 Fox Run
- 2192 Deer Run
- 2200 Deer Run
- 2223 Fox Run
- 2129 Flame Lake Dr
- 2223 Fox Run Cir
- 2232 Fox Run
- 2131 Flame Lake Dr
- 2135 Flame Lake Dr
- 2225 Fox Run
- 2139 Flame Lake Dr
- 2219 Deer Run
- 2198 N Park Ln
- 2228 Fox Run
- 2204 Deer Run
- 2037 Flame Lake Dr
- 2155 Flame Lake Dr