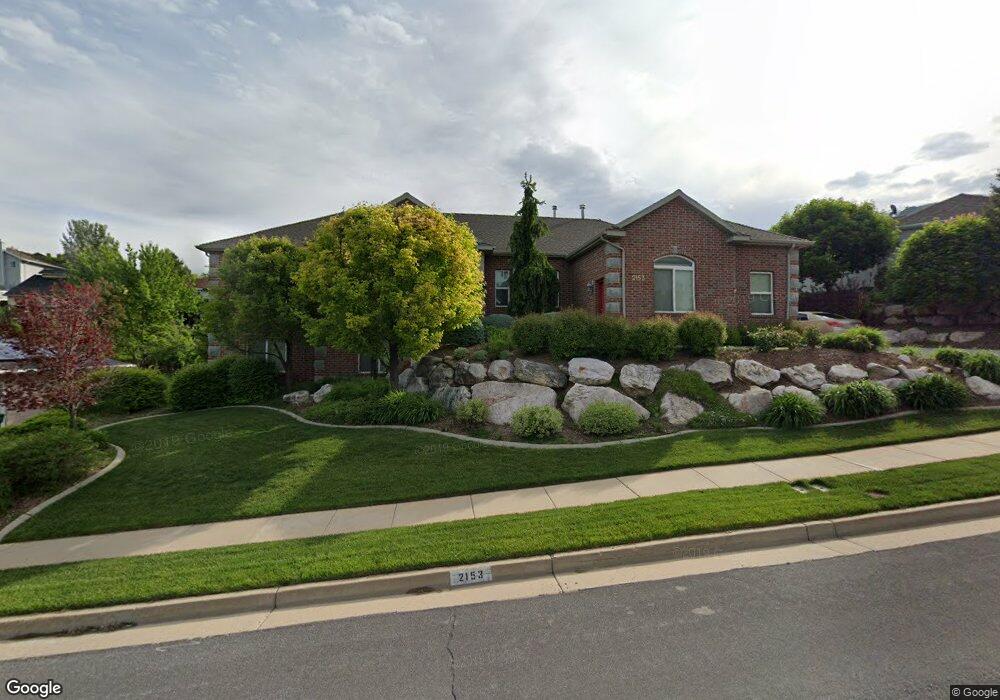
2153 Deere View Dr Layton, UT 84040
Estimated Value: $587,000 - $794,000
5
Beds
3
Baths
4,114
Sq Ft
$177/Sq Ft
Est. Value
About This Home
This home is located at 2153 Deere View Dr, Layton, UT 84040 and is currently estimated at $730,004, approximately $177 per square foot. 2153 Deere View Dr is a home located in Davis County with nearby schools including Mountain View Elementary School, North Layton Junior High School, and Northridge High School.
Ownership History
Date
Name
Owned For
Owner Type
Purchase Details
Closed on
Mar 31, 2013
Sold by
Hayes Paul W and Hayes Helen C
Bought by
Hayes Paul W and Hayes Helen C
Current Estimated Value
Purchase Details
Closed on
Jun 29, 2012
Sold by
Thomas Terry L
Bought by
Hayes Paul W and Hayes Helen C
Home Financials for this Owner
Home Financials are based on the most recent Mortgage that was taken out on this home.
Original Mortgage
$231,000
Outstanding Balance
$159,414
Interest Rate
3.74%
Mortgage Type
New Conventional
Estimated Equity
$570,590
Purchase Details
Closed on
Jun 11, 2003
Sold by
Jackson Kelly E and Jackson Lavonne
Bought by
Thomas Terry L
Home Financials for this Owner
Home Financials are based on the most recent Mortgage that was taken out on this home.
Original Mortgage
$244,800
Interest Rate
5.53%
Mortgage Type
Purchase Money Mortgage
Create a Home Valuation Report for This Property
The Home Valuation Report is an in-depth analysis detailing your home's value as well as a comparison with similar homes in the area
Home Values in the Area
Average Home Value in this Area
Purchase History
| Date | Buyer | Sale Price | Title Company |
|---|---|---|---|
| Hayes Paul W | -- | None Available | |
| Hayes Paul W | -- | Us Title Company Of | |
| Thomas Terry L | -- | Equity Title Agency |
Source: Public Records
Mortgage History
| Date | Status | Borrower | Loan Amount |
|---|---|---|---|
| Open | Hayes Paul W | $231,000 | |
| Previous Owner | Thomas Terry L | $244,800 |
Source: Public Records
Tax History
| Year | Tax Paid | Tax Assessment Tax Assessment Total Assessment is a certain percentage of the fair market value that is determined by local assessors to be the total taxable value of land and additions on the property. | Land | Improvement |
|---|---|---|---|---|
| 2025 | $3,861 | $386,100 | $139,423 | $246,677 |
| 2024 | $3,626 | $366,300 | $160,455 | $205,845 |
| 2023 | $3,606 | $646,000 | $210,609 | $435,391 |
| 2022 | $3,901 | $381,700 | $113,469 | $268,231 |
| 2021 | $3,579 | $522,000 | $173,490 | $348,510 |
| 2020 | $3,261 | $456,000 | $143,698 | $312,302 |
| 2019 | $3,263 | $449,000 | $127,664 | $321,336 |
| 2018 | $2,994 | $414,000 | $88,610 | $325,390 |
| 2016 | $2,932 | $212,795 | $41,325 | $171,470 |
| 2015 | $2,782 | $192,115 | $41,325 | $150,790 |
| 2014 | $2,728 | $193,137 | $41,325 | $151,812 |
| 2013 | -- | $192,892 | $38,490 | $154,402 |
Source: Public Records
Map
Nearby Homes
- 2353 Canyon View Dr
- 1935 Deere Valley Dr
- 3232 N Redtail Way
- 2597 N 2300 E
- 1821 E Whitetail Way
- 1827 E Whitetail Dr
- 1785 E 2825 N
- 1731 E 2825 N
- 2826 N 1600 E
- 2340 N 2050 E
- 2273 N 1975 E
- 3142 E Thorley Dr
- 3138 E Thorley Dr
- 2202 N 2300 E
- 1447 E 2700 N
- 3176 N 1450 E
- 2189 N 1950 E
- 2563 E 2250 N
- 2569 N 2900 E
- 1321 E 3125 N
- 2153 Deere View Dr Unit 1
- 2167 Deere View Dr
- 2145 Deere View Dr
- 2174 E 2900 N
- 2166 E 2900 N
- 2182 E 2900 N
- 2160 E 2900 N
- 2187 Deere View Dr
- 2123 Deere View Dr
- 2847 N 2175 E
- 2152 E 2900 N
- 2152 E 2900 N Unit 50
- 2190 E 2900 N
- 2140 Deere View Dr
- 2148 E 2900 N
- 2192 E 2900 N
- 2220 E 2900 N
- 2220 E 2900 N Unit 43
- 2211 Deere View Dr
- 2211 Deere View Dr
Your Personal Tour Guide
Ask me questions while you tour the home.