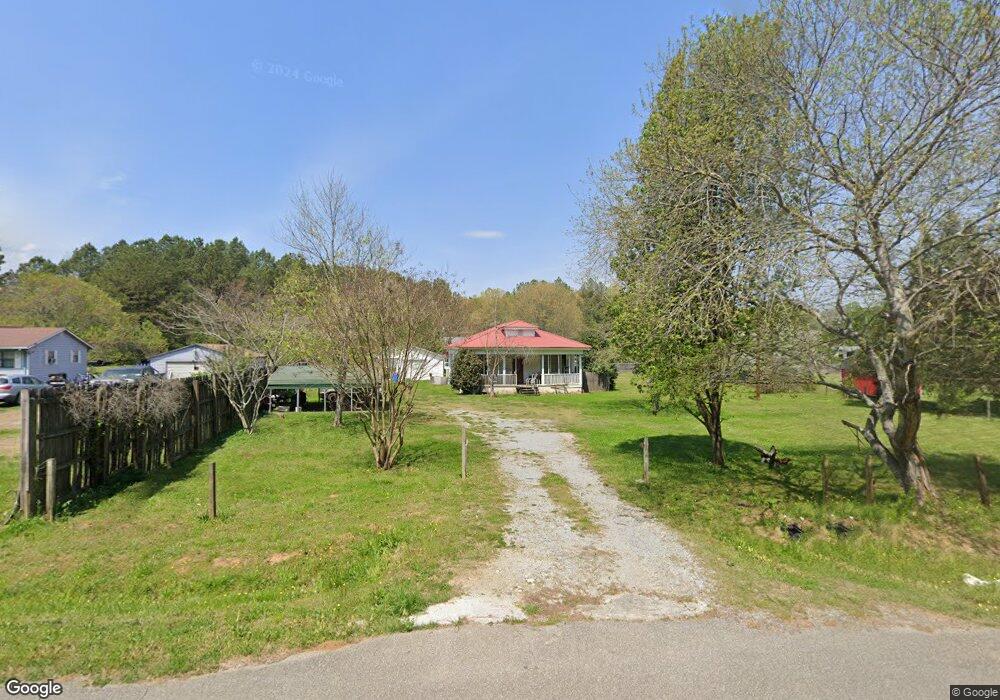
2153 Fish Creek Rd Cedartown, GA 30125
Estimated Value: $215,953 - $613,000
3
Beds
1
Bath
1,716
Sq Ft
$216/Sq Ft
Est. Value
About This Home
This home is located at 2153 Fish Creek Rd, Cedartown, GA 30125 and is currently estimated at $370,238, approximately $215 per square foot. 2153 Fish Creek Rd is a home located in Polk County.
Ownership History
Date
Name
Owned For
Owner Type
Purchase Details
Closed on
Apr 7, 2017
Sold by
Jones Vickie L
Bought by
Meadows Brian A and Meadows Reiane M
Current Estimated Value
Purchase Details
Closed on
May 10, 2005
Sold by
Wells Fargo Bank
Bought by
Jones Vickie L
Purchase Details
Closed on
Mar 1, 2005
Sold by
Webber Elvis
Bought by
Wells Fargo Bank Na Trustee
Purchase Details
Closed on
Aug 29, 1997
Sold by
Outlaw Mark and Outlaw Madlyn
Bought by
Webber Elvis
Purchase Details
Closed on
May 31, 1994
Sold by
Roberson Jack and Roberson Dan
Bought by
Outlaw Mark and Outlaw Madlyn E
Purchase Details
Closed on
Sep 23, 1993
Sold by
Little Edgar Neal
Bought by
Roberson Dan M and Roberson Jack
Purchase Details
Closed on
May 15, 1993
Sold by
Roberson Dan M
Bought by
Little Edgar N
Purchase Details
Closed on
Mar 31, 1993
Sold by
Esparza Melchor
Bought by
Roberson Dan M
Purchase Details
Closed on
Mar 14, 1989
Sold by
Appley Richard D
Bought by
Esparza Melchor
Purchase Details
Closed on
May 5, 1986
Bought by
Appley R D
Create a Home Valuation Report for This Property
The Home Valuation Report is an in-depth analysis detailing your home's value as well as a comparison with similar homes in the area
Home Values in the Area
Average Home Value in this Area
Purchase History
| Date | Buyer | Sale Price | Title Company |
|---|---|---|---|
| Meadows Brian A | -- | -- | |
| Jones Vickie L | $24,000 | -- | |
| Wells Fargo Bank Na Trustee | $30,150 | -- | |
| Webber Elvis | $41,900 | -- | |
| Outlaw Mark | $18,000 | -- | |
| Roberson Dan M | -- | -- | |
| Little Edgar N | $20,000 | -- | |
| Roberson Dan M | $10,000 | -- | |
| Esparza Melchor | $11,000 | -- | |
| Appley R D | -- | -- |
Source: Public Records
Tax History Compared to Growth
Tax History
| Year | Tax Paid | Tax Assessment Tax Assessment Total Assessment is a certain percentage of the fair market value that is determined by local assessors to be the total taxable value of land and additions on the property. | Land | Improvement |
|---|---|---|---|---|
| 2024 | $1,001 | $49,879 | $3,535 | $46,344 |
| 2023 | $766 | $34,273 | $3,535 | $30,738 |
| 2022 | $646 | $29,207 | $2,357 | $26,850 |
| 2021 | $654 | $29,207 | $2,357 | $26,850 |
| 2020 | $655 | $29,207 | $2,357 | $26,850 |
| 2019 | $564 | $22,988 | $2,357 | $20,631 |
| 2018 | $534 | $21,372 | $2,357 | $19,015 |
| 2017 | $582 | $21,372 | $2,357 | $19,015 |
| 2016 | $513 | $20,863 | $1,848 | $19,015 |
| 2015 | $523 | $21,167 | $1,848 | $19,319 |
| 2014 | $527 | $21,167 | $1,848 | $19,319 |
Source: Public Records
Map
Nearby Homes
- 0 Stewart Rd
- 565 Raiford Rd
- 231 Gordon Rd
- 573 Relay Rd SE
- 2944 Old Collard Valley Rd
- 0 Colquitt Rd Unit 25175705
- 0 Colquitt Rd Unit 7661475
- 0 Colquitt Rd Unit 10623944
- 2129 Lake Creek Rd
- 158 Woodsmoke Rd
- 6792 Rockmart Rd SE
- 110 Mulberry Ln
- 1104 Burkhalter Rd SE
- 0 Hwy 101 and Dean Rd Unit 10620814
- 2705 Collard Valley Rd
- 1170 Lake Creek Rd
- 0 Benefield Rd Unit 7479734
- 0 Benefield Rd Unit 10405501
- 0 Richard Pullen Rd Unit 10577442
- 0 Richard Pullen Rd Unit 7626794
- 1310 Dunn Rd
- 2137 Fish Creek Rd
- 1310 Dunn Rd SE
- 1280 Dunn Rd SE
- 2121 Fish Creek Rd
- 1267 Dunn Rd SE
- 1287 Dunn Rd SE
- 1260 Dunn Rd SE
- 1297 Dunn Rd SE
- 1255 Dunn Rd SE
- 2194 Fish Creek Rd
- 2156 Fish Creek Rd
- 1289 Dunn Rd SE
- 1291 Dunn Rd SE
- 2085 Fish Creek Rd
- 1143 Dunn Rd SE
- 1984 Fish Creek Rd
- 1140 Dunn Rd SE
- 1130 Dunn Rd SE
- 2252 Fish Creek Rd