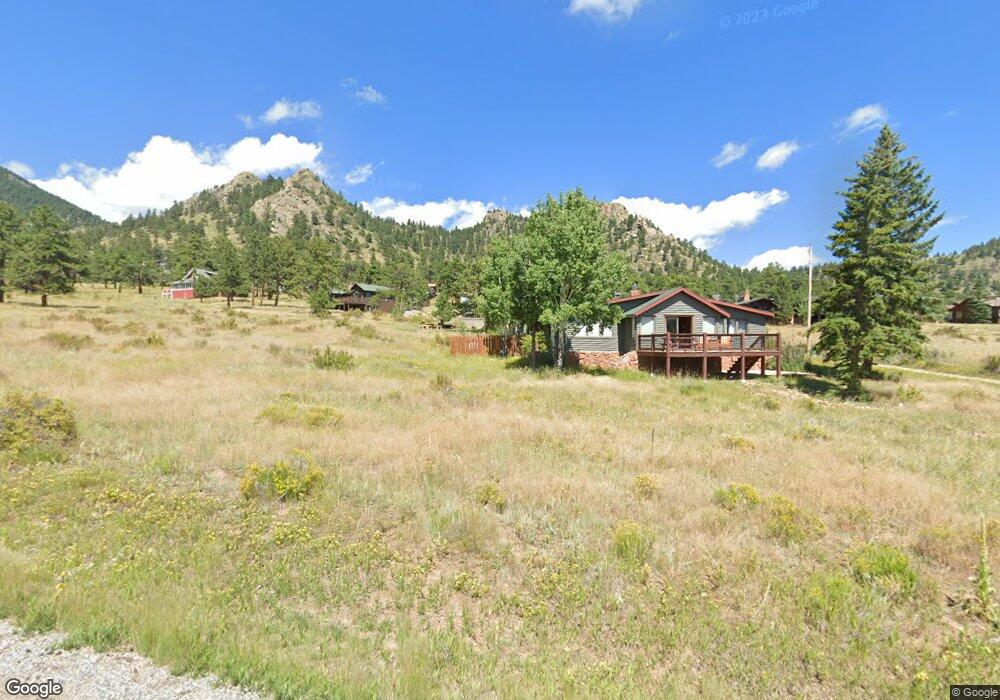
2153 High Dr Estes Park, CO 80517
Estimated Value: $536,036 - $599,000
2
Beds
2
Baths
825
Sq Ft
$685/Sq Ft
Est. Value
About This Home
This home is located at 2153 High Dr, Estes Park, CO 80517 and is currently estimated at $565,509, approximately $685 per square foot. 2153 High Dr is a home located in Larimer County with nearby schools including Estes Park K-5 School, Estes Park Options School, and Estes Park Middle School.
Ownership History
Date
Name
Owned For
Owner Type
Purchase Details
Closed on
Jan 31, 2020
Sold by
Walker Audrey J
Bought by
Saw03 Llc
Current Estimated Value
Purchase Details
Closed on
Jan 1, 2008
Sold by
Walker Joel Edward and Walker Audrey J
Bought by
2153 High Drive Llc
Purchase Details
Closed on
Dec 18, 2006
Sold by
Hoyer Eric R and Hoyer Lisa L
Bought by
Walker Audrey J and Walker Ii Joel Edward
Purchase Details
Closed on
May 3, 2000
Sold by
Kendall Orval E
Bought by
Hoyer Eric R and Hoyer Lisa L
Home Financials for this Owner
Home Financials are based on the most recent Mortgage that was taken out on this home.
Original Mortgage
$140,000
Interest Rate
8%
Mortgage Type
Seller Take Back
Purchase Details
Closed on
Aug 1, 1994
Sold by
Kendall Orpha I
Bought by
Kendall Orpha I
Create a Home Valuation Report for This Property
The Home Valuation Report is an in-depth analysis detailing your home's value as well as a comparison with similar homes in the area
Home Values in the Area
Average Home Value in this Area
Purchase History
| Date | Buyer | Sale Price | Title Company |
|---|---|---|---|
| Saw03 Llc | -- | None Available | |
| Walker Audrey J | -- | None Available | |
| 2153 High Drive Llc | -- | None Available | |
| Walker Audrey J | $279,000 | None Available | |
| Hoyer Eric R | $150,000 | -- | |
| Kendall Orpha I | -- | -- |
Source: Public Records
Mortgage History
| Date | Status | Borrower | Loan Amount |
|---|---|---|---|
| Previous Owner | Hoyer Eric R | $140,000 |
Source: Public Records
Tax History Compared to Growth
Tax History
| Year | Tax Paid | Tax Assessment Tax Assessment Total Assessment is a certain percentage of the fair market value that is determined by local assessors to be the total taxable value of land and additions on the property. | Land | Improvement |
|---|---|---|---|---|
| 2025 | $2,374 | $36,930 | $13,400 | $23,530 |
| 2024 | $2,348 | $36,930 | $13,400 | $23,530 |
| 2022 | $2,183 | $29,288 | $11,704 | $17,584 |
| 2021 | $2,242 | $30,131 | $12,041 | $18,090 |
| 2020 | $1,950 | $25,833 | $11,583 | $14,250 |
| 2019 | $1,936 | $25,833 | $11,583 | $14,250 |
| 2018 | $1,460 | $18,886 | $10,224 | $8,662 |
| 2017 | $1,469 | $18,886 | $10,224 | $8,662 |
| 2016 | $1,464 | $19,502 | $10,189 | $9,313 |
| 2015 | $1,446 | $19,500 | $10,190 | $9,310 |
| 2014 | $1,094 | $15,170 | $10,030 | $5,140 |
Source: Public Records
Map
Nearby Homes
- 725 Upper Larkspur Ln
- 739 Larkspur Rd
- 1611 High Dr
- 810 Larkspur Rd
- 811 Larkspur Rd
- 1565 Highway 66 Unit 46
- 1565 Highway 66 Unit 33
- 1565 Highway 66 Unit 27
- 1565 Highway 66 Unit 49
- 1565 Highway 66 Unit 28
- 831 Larkspur Rd
- 1401 High Dr
- 2220 Eagle Cliff Rd
- 2238 Eagle Cliff Rd
- 1575 Lower Broadview Rd
- 2327 Deer Ridge Dr
- 1263 Broadview
- 870 Moraine Ave
- 2325 Highway 66
- 1141 Wallace Ln
- 2161 High Dr
- 2141 High Dr
- 2130 High Dr
- 2184 Upper High Dr
- 2181 High Dr
- 2133 High Dr
- 2180 Gaillardia Dr
- 2061 High Dr
- 2190 Gaillardia Dr
- 2130 Upper High Dr
- 2075 Middle High Dr
- 2211 High Dr
- 2201 High Dr
- 2221 High Dr
- 2041 High Dr
- 2120 Upper High Dr
- 2160 Upper High Dr
- 2110 Penstemon Dr
- 2261 High Dr
- 2200 Penstemon Dr