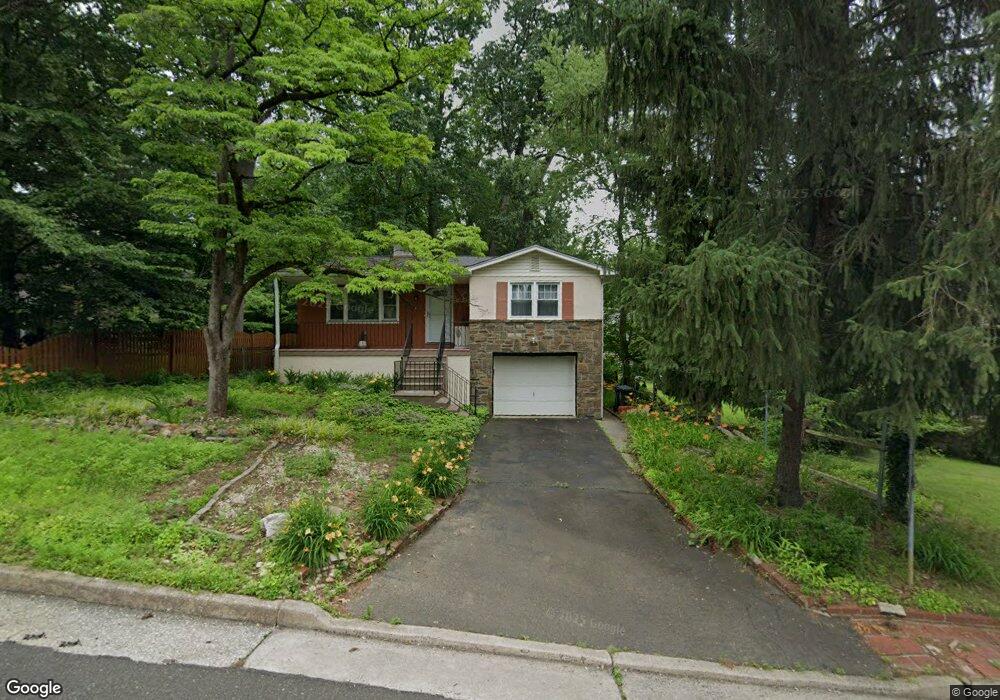
2153 Kent Rd Abington, PA 19001
Estimated Value: $393,000 - $476,000
3
Beds
3
Baths
1,414
Sq Ft
$302/Sq Ft
Est. Value
About This Home
This home is located at 2153 Kent Rd, Abington, PA 19001 and is currently estimated at $426,656, approximately $301 per square foot. 2153 Kent Rd is a home located in Montgomery County with nearby schools including Highland School, Abington Middle School, and Abington Senior High School.
Ownership History
Date
Name
Owned For
Owner Type
Purchase Details
Closed on
Apr 26, 2005
Sold by
Not Provided
Bought by
Cole Verna S
Current Estimated Value
Home Financials for this Owner
Home Financials are based on the most recent Mortgage that was taken out on this home.
Original Mortgage
$220,000
Outstanding Balance
$115,960
Interest Rate
6.01%
Mortgage Type
New Conventional
Estimated Equity
$310,696
Purchase Details
Closed on
Apr 16, 2005
Sold by
Not Provided
Bought by
Cole Verna S
Home Financials for this Owner
Home Financials are based on the most recent Mortgage that was taken out on this home.
Original Mortgage
$220,000
Outstanding Balance
$115,960
Interest Rate
6.01%
Mortgage Type
New Conventional
Estimated Equity
$310,696
Purchase Details
Closed on
Mar 24, 2005
Sold by
Flaherty Lillian D
Bought by
Worthington Ann
Home Financials for this Owner
Home Financials are based on the most recent Mortgage that was taken out on this home.
Original Mortgage
$220,000
Outstanding Balance
$115,960
Interest Rate
6.01%
Mortgage Type
New Conventional
Estimated Equity
$310,696
Create a Home Valuation Report for This Property
The Home Valuation Report is an in-depth analysis detailing your home's value as well as a comparison with similar homes in the area
Home Values in the Area
Average Home Value in this Area
Purchase History
| Date | Buyer | Sale Price | Title Company |
|---|---|---|---|
| Cole Verna S | $298,000 | -- | |
| Cole Verna S | $298,000 | -- | |
| Worthington Ann | $160,000 | -- | |
| Flaherty Lillian D | -- | -- |
Source: Public Records
Mortgage History
| Date | Status | Borrower | Loan Amount |
|---|---|---|---|
| Open | Cole Verna S | $220,000 | |
| Closed | Cole Verna S | $220,000 |
Source: Public Records
Tax History
| Year | Tax Paid | Tax Assessment Tax Assessment Total Assessment is a certain percentage of the fair market value that is determined by local assessors to be the total taxable value of land and additions on the property. | Land | Improvement |
|---|---|---|---|---|
| 2025 | $5,774 | $124,680 | $51,320 | $73,360 |
| 2024 | $5,774 | $124,680 | $51,320 | $73,360 |
| 2023 | $5,533 | $124,680 | $51,320 | $73,360 |
| 2022 | $5,356 | $124,680 | $51,320 | $73,360 |
| 2021 | $5,067 | $124,680 | $51,320 | $73,360 |
| 2020 | $4,995 | $124,680 | $51,320 | $73,360 |
| 2019 | $4,995 | $124,680 | $51,320 | $73,360 |
| 2018 | $4,995 | $124,680 | $51,320 | $73,360 |
| 2017 | $4,848 | $124,680 | $51,320 | $73,360 |
| 2016 | $4,799 | $124,680 | $51,320 | $73,360 |
| 2015 | $4,511 | $124,680 | $51,320 | $73,360 |
| 2014 | $4,511 | $124,680 | $51,320 | $73,360 |
Source: Public Records
Map
Nearby Homes
- 1132 Edge Hill Rd
- 1135 Grovania Ave
- 1146 Wheatsheaf Ln
- 1191 Wheatsheaf Ln
- 1339 Wheatsheaf Ln
- 2189 Schaeffer Rd
- 1081 Wynnwood Rd
- 2242 Clearview Ave
- 2233 Clearview Ave
- 1430 Aubrey Ave
- 1857 Eckard Ave
- 2473 Susquehanna Rd
- 1370 Arnold Ave
- 1536 Rothley Ave
- 868 Tyson Ave
- 2538 Woodland Rd
- 1000 Old York Rd
- 874 Edge Hill Rd
- 0 Washington Ave
- 1578 Prospect Ave
- 2149 Kent Rd
- 1171 Edge Hill Rd
- 2143 Kent Rd
- 1179 Edge Hill Rd
- 2148 Horace Ave
- 2152 Kent Rd
- 1157 Edge Hill Rd
- 2148 Kent Rd
- 2142 Horace Ave
- 2137 Kent Rd
- 2142 Kent Rd
- 1153 Edge Hill Rd
- 2136 Horace Ave
- 2138 Kent Rd
- 2133 Kent Rd
- 1166 Edge Hill Rd
- 1205 Edge Hill Rd
- 2134 Kent Rd
- 2155 Guernsey Ave
- 1147 Edge Hill Rd
Your Personal Tour Guide
Ask me questions while you tour the home.