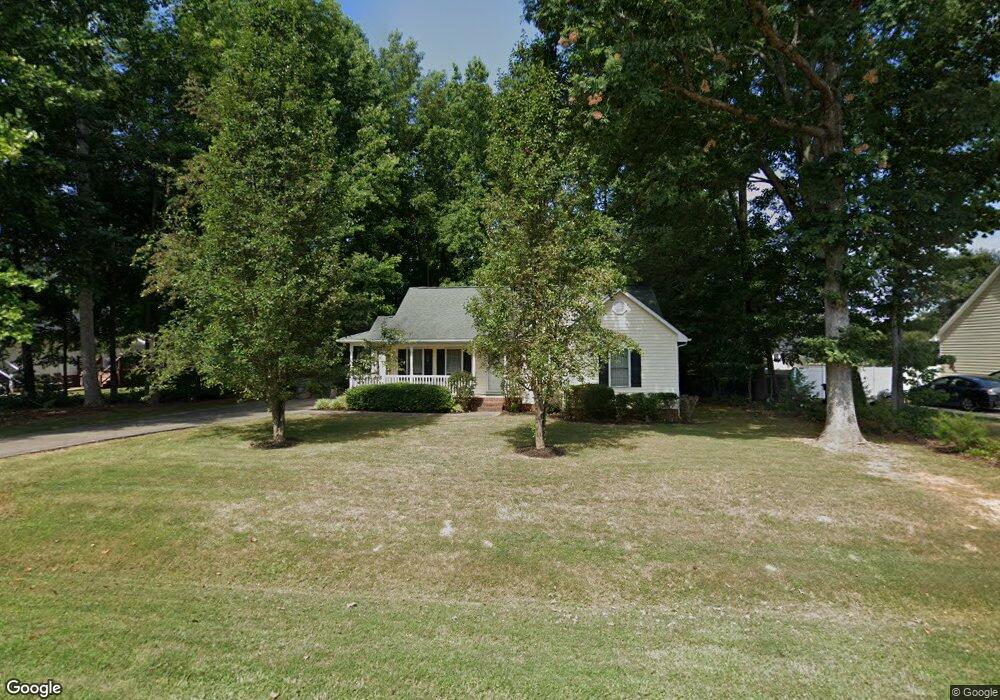
2153 Machala Dr Randleman, NC 27317
Estimated Value: $246,601 - $288,000
Studio
2
Baths
1,334
Sq Ft
$204/Sq Ft
Est. Value
About This Home
This home is located at 2153 Machala Dr, Randleman, NC 27317 and is currently estimated at $271,650, approximately $203 per square foot. 2153 Machala Dr is a home located in Randolph County with nearby schools including Randleman Elementary School, Randleman Middle School, and Randleman High School.
Ownership History
Date
Name
Owned For
Owner Type
Purchase Details
Closed on
Aug 10, 2020
Sold by
Goins Karen C
Bought by
Goins Karen C
Current Estimated Value
Home Financials for this Owner
Home Financials are based on the most recent Mortgage that was taken out on this home.
Original Mortgage
$128,000
Outstanding Balance
$90,231
Interest Rate
3%
Mortgage Type
New Conventional
Estimated Equity
$181,419
Purchase Details
Closed on
Feb 26, 2004
Sold by
Goins Donald R
Bought by
Goins Karen C
Home Financials for this Owner
Home Financials are based on the most recent Mortgage that was taken out on this home.
Original Mortgage
$96,000
Interest Rate
5.63%
Mortgage Type
New Conventional
Purchase Details
Closed on
Aug 29, 2003
Bought by
Goins Karen C
Create a Home Valuation Report for This Property
The Home Valuation Report is an in-depth analysis detailing your home's value as well as a comparison with similar homes in the area
Home Values in the Area
Average Home Value in this Area
Purchase History
| Date | Buyer | Sale Price | Title Company |
|---|---|---|---|
| Goins Karen C | -- | Vylla Llc | |
| Goins Karen C | -- | -- | |
| Goins Karen C | $115,000 | -- |
Source: Public Records
Mortgage History
| Date | Status | Borrower | Loan Amount |
|---|---|---|---|
| Open | Goins Karen C | $128,000 | |
| Closed | Goins Karen C | $96,000 | |
| Closed | Goins Karen C | $24,000 |
Source: Public Records
Tax History
| Year | Tax Paid | Tax Assessment Tax Assessment Total Assessment is a certain percentage of the fair market value that is determined by local assessors to be the total taxable value of land and additions on the property. | Land | Improvement |
|---|---|---|---|---|
| 2025 | $2,368 | $195,710 | $38,780 | $156,930 |
| 2024 | $2,368 | $195,710 | $38,780 | $156,930 |
| 2023 | $2,368 | $195,710 | $38,780 | $156,930 |
| 2022 | $1,612 | $124,220 | $19,910 | $104,310 |
| 2021 | $1,612 | $124,220 | $19,910 | $104,310 |
| 2020 | $1,612 | $124,220 | $19,910 | $104,310 |
| 2019 | $1,612 | $124,220 | $19,910 | $104,310 |
| 2018 | $1,416 | $107,470 | $19,910 | $87,560 |
| 2016 | $1,416 | $107,465 | $19,910 | $87,555 |
| 2015 | $1,419 | $107,465 | $19,910 | $87,555 |
| 2014 | $1,381 | $107,465 | $19,910 | $87,555 |
Source: Public Records
Map
Nearby Homes
- 2403 Regency Dr
- 2360 Regency Dr
- 1112 Heathwood Dr
- 1226 Old Liberty Rd
- 2048 Heritage Ct
- 519 Sunrise Ave
- 911 Old Liberty Rd
- 1058 Pearl Ct
- 1907 Levance St
- 1174 Barkwood Rd
- 307 Sunrise Ave
- 1931 Greenwood Rd
- 734 Central Falls Rd
- 728 Central Falls Rd
- 203 Sunrise Ave
- 738 Oak Bend Dr
- 740 Oak Bend Dr
- 00-00 4th Park Ave Unit L20-22
- 00-00 4th Park Ave
- 2339 Hickory Forest Dr
- 2159 Machala Dr
- 2148 Sarina Dr
- 1139 Windover Rd
- 2158 Spearmint Dr
- 2418 Regency Dr
- 2156 Machala Dr
- 2142 Machala Dr
- 2434 Regency Dr
- 2406 Regency Dr
- 2444 Regency Dr
- 1152 Windover Rd
- 1144 Windover Rd
- 1136 Windover Rd
- 1162 Windover Rd
- 1115 Windover Rd
- 2454 Regency Dr
- 2390 Regency Dr
- 2137 Regency Dr
- 2423 Regency Dr
- 1170 Windover Rd