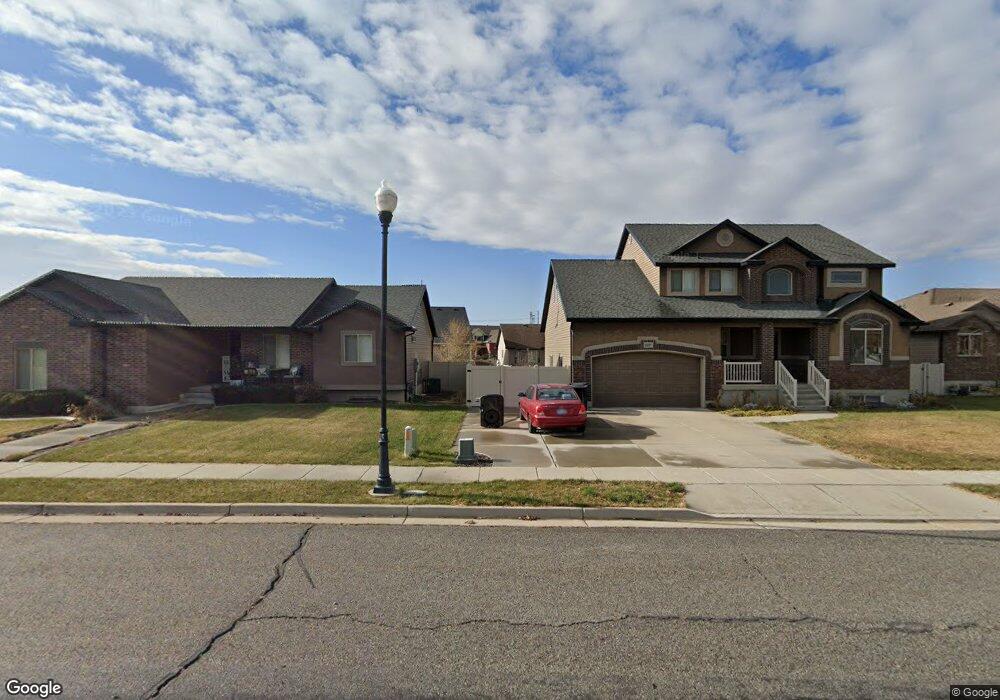
2153 N 1410 W Clearfield, UT 84015
Estimated Value: $579,000 - $635,000
6
Beds
3
Baths
3,518
Sq Ft
$174/Sq Ft
Est. Value
About This Home
This home is located at 2153 N 1410 W, Clearfield, UT 84015 and is currently estimated at $610,867, approximately $173 per square foot. 2153 N 1410 W is a home located in Davis County with nearby schools including Parkside Elementary School, Sunset Junior High School, and Clearfield High School.
Ownership History
Date
Name
Owned For
Owner Type
Purchase Details
Closed on
Sep 22, 2016
Sold by
Lynch Joshua
Bought by
Woolley Jacob P and Woolley Rachel
Current Estimated Value
Purchase Details
Closed on
Sep 24, 2010
Sold by
Shron Inc
Bought by
Lynch Joshua
Home Financials for this Owner
Home Financials are based on the most recent Mortgage that was taken out on this home.
Original Mortgage
$190,000
Interest Rate
4.38%
Mortgage Type
New Conventional
Create a Home Valuation Report for This Property
The Home Valuation Report is an in-depth analysis detailing your home's value as well as a comparison with similar homes in the area
Home Values in the Area
Average Home Value in this Area
Purchase History
| Date | Buyer | Sale Price | Title Company |
|---|---|---|---|
| Woolley Jacob P | -- | Mountain View Title | |
| Lynch Joshua | -- | Home Abst & Title Co |
Source: Public Records
Mortgage History
| Date | Status | Borrower | Loan Amount |
|---|---|---|---|
| Previous Owner | Lynch Joshua | $190,000 |
Source: Public Records
Tax History Compared to Growth
Tax History
| Year | Tax Paid | Tax Assessment Tax Assessment Total Assessment is a certain percentage of the fair market value that is determined by local assessors to be the total taxable value of land and additions on the property. | Land | Improvement |
|---|---|---|---|---|
| 2025 | $3,346 | $321,750 | $101,801 | $219,949 |
| 2024 | $3,204 | $309,650 | $111,164 | $198,486 |
| 2023 | $3,058 | $547,000 | $127,769 | $419,231 |
| 2022 | $3,230 | $319,550 | $76,585 | $242,965 |
| 2021 | $2,882 | $423,000 | $98,542 | $324,458 |
| 2020 | $2,513 | $365,000 | $85,176 | $279,824 |
| 2019 | $2,544 | $361,000 | $96,873 | $264,127 |
| 2018 | $2,417 | $337,000 | $81,480 | $255,520 |
| 2016 | $121 | $167,035 | $32,026 | $135,009 |
| 2015 | $2,199 | $150,535 | $32,026 | $118,509 |
| 2014 | $2,054 | $142,836 | $32,026 | $110,810 |
| 2013 | -- | $163,099 | $27,143 | $135,956 |
Source: Public Records
Map
Nearby Homes