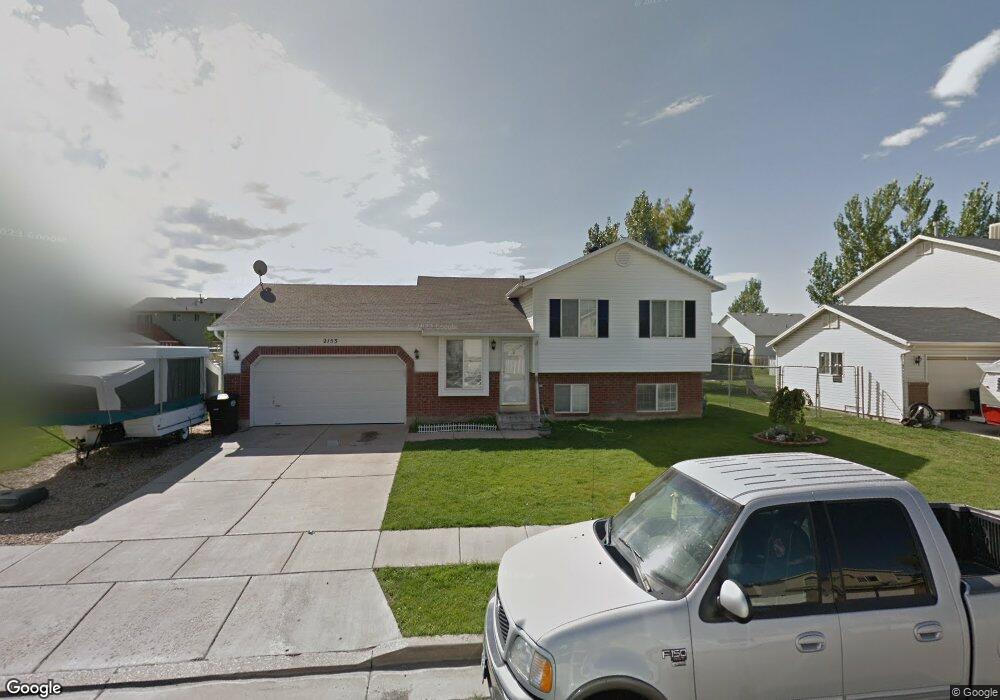
2153 W 1630 N Clearfield, UT 84015
Estimated Value: $391,000 - $419,000
3
Beds
1
Bath
990
Sq Ft
$413/Sq Ft
Est. Value
About This Home
This home is located at 2153 W 1630 N, Clearfield, UT 84015 and is currently estimated at $409,205, approximately $413 per square foot. 2153 W 1630 N is a home located in Davis County with nearby schools including Parkside Elementary School, West Point Junior High School, and Clearfield High School.
Ownership History
Date
Name
Owned For
Owner Type
Purchase Details
Closed on
Dec 9, 2005
Sold by
Johnson Eric M and Johnson Sunshine T
Bought by
Kunzler Darin and Kunzler Trisha
Current Estimated Value
Home Financials for this Owner
Home Financials are based on the most recent Mortgage that was taken out on this home.
Original Mortgage
$26,380
Outstanding Balance
$14,542
Interest Rate
6.14%
Mortgage Type
Stand Alone Second
Estimated Equity
$394,663
Purchase Details
Closed on
Jan 16, 2004
Sold by
Johnson Eric M
Bought by
Johnson Eric M and Johnson Sunshine T
Home Financials for this Owner
Home Financials are based on the most recent Mortgage that was taken out on this home.
Original Mortgage
$101,471
Interest Rate
5.86%
Mortgage Type
FHA
Purchase Details
Closed on
Aug 28, 1998
Sold by
Johnson Sunshine T
Bought by
Johnson Eric M
Purchase Details
Closed on
Jan 29, 1998
Sold by
Charliemark Homes Lc
Bought by
Johnson Eric M and Johnson Sunshine T
Create a Home Valuation Report for This Property
The Home Valuation Report is an in-depth analysis detailing your home's value as well as a comparison with similar homes in the area
Home Values in the Area
Average Home Value in this Area
Purchase History
| Date | Buyer | Sale Price | Title Company |
|---|---|---|---|
| Kunzler Darin | -- | Backman Title Services | |
| Johnson Eric M | -- | Surety Title Agency | |
| Johnson Eric M | -- | Avis & Archibald Title Ins | |
| Johnson Eric M | -- | Northern Title & Escrow |
Source: Public Records
Mortgage History
| Date | Status | Borrower | Loan Amount |
|---|---|---|---|
| Open | Kunzler Darin | $26,380 | |
| Open | Kunzler Darin | $105,520 | |
| Previous Owner | Johnson Eric M | $101,471 |
Source: Public Records
Tax History Compared to Growth
Tax History
| Year | Tax Paid | Tax Assessment Tax Assessment Total Assessment is a certain percentage of the fair market value that is determined by local assessors to be the total taxable value of land and additions on the property. | Land | Improvement |
|---|---|---|---|---|
| 2025 | $2,053 | $197,450 | $86,993 | $110,457 |
| 2024 | $1,980 | $191,400 | $95,964 | $95,436 |
| 2023 | $1,817 | $325,000 | $108,586 | $216,414 |
| 2022 | $1,935 | $191,400 | $67,156 | $124,244 |
| 2021 | $1,771 | $260,000 | $82,833 | $177,167 |
| 2020 | $1,528 | $222,000 | $69,736 | $152,264 |
| 2019 | $1,480 | $210,000 | $82,697 | $127,303 |
| 2018 | $1,370 | $191,000 | $70,008 | $120,992 |
| 2016 | $1,197 | $86,185 | $27,124 | $59,061 |
| 2015 | $1,164 | $79,695 | $27,124 | $52,571 |
| 2014 | $1,095 | $76,117 | $27,124 | $48,993 |
| 2013 | -- | $75,307 | $25,731 | $49,576 |
Source: Public Records
Map
Nearby Homes
- 2148 W 1570 N
- 1694 N 2225 W
- 1502 N 2090 W
- 2259 W 1800 N
- 1458 N 2400 W
- 1923 W 1340 N
- 1509 N 2475 W
- 1449 N 2475 W
- 1331 N 1850 W
- 1317 N 1850 W
- 2371 W 1300 N
- 2616 N 2125 W Unit 147
- 2034 N 2095 W
- 1648 N 2615 W
- 1251 N 2525 W
- 2647 W 1445 N
- 2184 N 2000 W
- 1657 N 1500 W
- Harvard Plan at Summerfield - Enclave
- 2208 W 2615 N