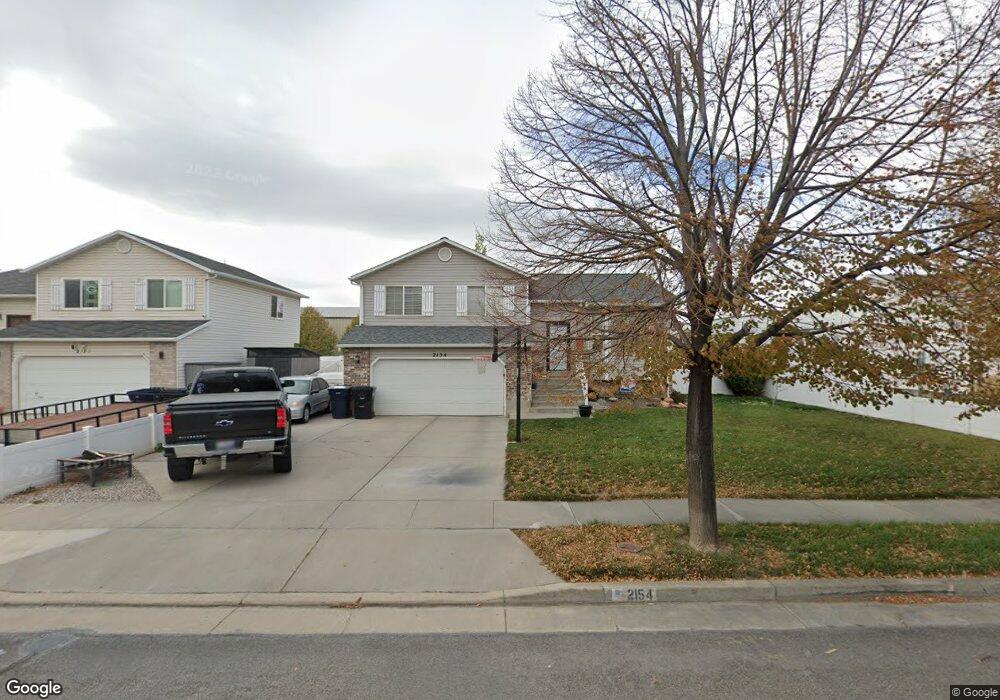
2154 S 1600 W Woods Cross, UT 84087
Estimated Value: $493,000 - $547,000
4
Beds
2
Baths
1,170
Sq Ft
$440/Sq Ft
Est. Value
About This Home
This home is located at 2154 S 1600 W, Woods Cross, UT 84087 and is currently estimated at $514,552, approximately $439 per square foot. 2154 S 1600 W is a home located in Davis County with nearby schools including Odyssey School, South Davis Junior High School, and Woods Cross High School.
Ownership History
Date
Name
Owned For
Owner Type
Purchase Details
Closed on
Jun 27, 2003
Sold by
Rough Jason and Rough Mandy L
Bought by
Rough Jason and Rough Mandy
Current Estimated Value
Home Financials for this Owner
Home Financials are based on the most recent Mortgage that was taken out on this home.
Original Mortgage
$143,034
Outstanding Balance
$60,789
Interest Rate
5.37%
Mortgage Type
FHA
Estimated Equity
$453,763
Purchase Details
Closed on
Oct 11, 1999
Sold by
Woodside Homes Corp
Bought by
Rough Jason and Rough Mandy L
Home Financials for this Owner
Home Financials are based on the most recent Mortgage that was taken out on this home.
Original Mortgage
$143,168
Interest Rate
7.77%
Mortgage Type
FHA
Create a Home Valuation Report for This Property
The Home Valuation Report is an in-depth analysis detailing your home's value as well as a comparison with similar homes in the area
Home Values in the Area
Average Home Value in this Area
Purchase History
| Date | Buyer | Sale Price | Title Company |
|---|---|---|---|
| Rough Jason | -- | Us Title | |
| Rough Jason | -- | First American Title Co |
Source: Public Records
Mortgage History
| Date | Status | Borrower | Loan Amount |
|---|---|---|---|
| Open | Rough Jason | $143,034 | |
| Closed | Rough Jason | $143,168 |
Source: Public Records
Tax History Compared to Growth
Tax History
| Year | Tax Paid | Tax Assessment Tax Assessment Total Assessment is a certain percentage of the fair market value that is determined by local assessors to be the total taxable value of land and additions on the property. | Land | Improvement |
|---|---|---|---|---|
| 2025 | $2,829 | $244,200 | $111,695 | $132,505 |
| 2024 | $2,944 | $235,400 | $119,087 | $116,313 |
| 2023 | $2,499 | $410,000 | $157,761 | $252,239 |
| 2022 | $2,775 | $232,100 | $68,565 | $163,535 |
| 2021 | $2,412 | $329,000 | $100,609 | $228,391 |
| 2020 | $2,103 | $289,000 | $95,759 | $193,241 |
| 2019 | $2,071 | $280,000 | $89,365 | $190,635 |
| 2018 | $1,853 | $258,000 | $87,881 | $170,119 |
| 2016 | $1,594 | $122,265 | $37,474 | $84,791 |
| 2015 | $1,524 | $112,805 | $37,474 | $75,331 |
| 2014 | $1,585 | $120,998 | $37,474 | $83,524 |
| 2013 | -- | $108,897 | $27,193 | $81,704 |
Source: Public Records
Map
Nearby Homes
- 1998 S 1600 W
- 1984 S 1500 W
- 1384 W 2175 S
- 1846 W 2280 S
- 1255 W 2050 S
- 826 W Ivywell Ln Unit 219
- 828 W Ivywell Ln Unit 220
- 1153 N Meridian Ln Unit 120
- 1160 N Clifton Dr Unit 114
- 1156 N Clifton Dr Unit 115
- 1971 W 1870 S
- Kensington Plan at Clifton Place Townhomes
- Charleston Plan at Clifton Place Townhomes
- Camden Plan at Clifton Place Townhomes
- Somerset A Plan at Clifton Place Townhomes
- Somerset B Plan at Clifton Place Townhomes
- 2038 W 2185 S
- 908 Halstead Dr
- 2304 S 2060 W
- 1844 S 2065 W