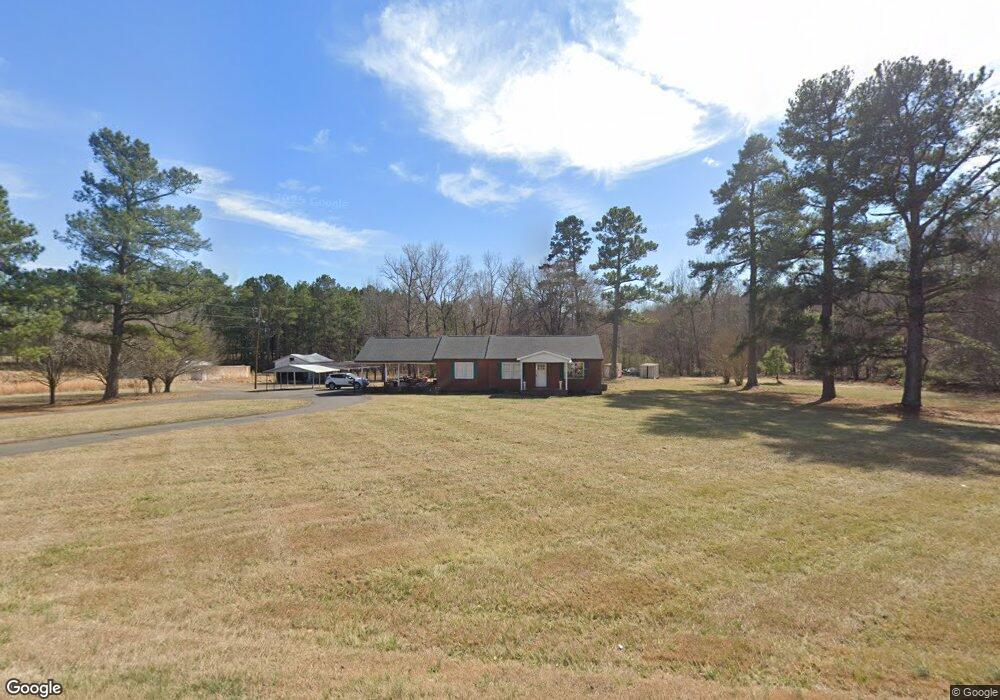
2154 Us Highway 158 Oxford, NC 27565
Estimated Value: $288,000 - $757,515
--
Bed
1
Bath
2,336
Sq Ft
$224/Sq Ft
Est. Value
About This Home
This home is located at 2154 Us Highway 158, Oxford, NC 27565 and is currently estimated at $522,758, approximately $223 per square foot. 2154 Us Highway 158 is a home located in Granville County with nearby schools including West Oxford Elementary School, Northern Granville Middle School, and J.F. Webb High School.
Ownership History
Date
Name
Owned For
Owner Type
Purchase Details
Closed on
Jun 28, 2022
Sold by
Hughes Barbour Jessica
Bought by
Barbour Ryan D
Current Estimated Value
Purchase Details
Closed on
Jul 9, 2018
Sold by
Barbour Martha M
Bought by
Barbour Rayn D
Purchase Details
Closed on
Jun 8, 2018
Sold by
Boyd Bettie Lou M and Morris Roger D
Bought by
Morris Roger Dewey and Barbour Martha Morris
Purchase Details
Closed on
Apr 17, 2017
Sold by
Dean Mildred M and Dean Alfred B
Bought by
Morris Jonathan Howard Lawrence
Purchase Details
Closed on
Dec 5, 2016
Sold by
Dean Mildred M and Dean Alfred B
Bought by
Morris Jonathan Howard Lawrence
Home Financials for this Owner
Home Financials are based on the most recent Mortgage that was taken out on this home.
Original Mortgage
$34,680
Interest Rate
3.52%
Mortgage Type
Seller Take Back
Create a Home Valuation Report for This Property
The Home Valuation Report is an in-depth analysis detailing your home's value as well as a comparison with similar homes in the area
Home Values in the Area
Average Home Value in this Area
Purchase History
| Date | Buyer | Sale Price | Title Company |
|---|---|---|---|
| Barbour Ryan D | -- | Duckworth James T | |
| Barbour Ryan D | -- | Duckworth James T | |
| Barbour Rayn D | -- | None Available | |
| Morris Roger Dewey | -- | None Available | |
| Morris Jonathan Howard Lawrence | -- | None Available | |
| Morris Jonathan Howard Lawrence | $35,000 | None Available |
Source: Public Records
Mortgage History
| Date | Status | Borrower | Loan Amount |
|---|---|---|---|
| Previous Owner | Morris Jonathan Howard Lawrence | $34,680 |
Source: Public Records
Tax History Compared to Growth
Tax History
| Year | Tax Paid | Tax Assessment Tax Assessment Total Assessment is a certain percentage of the fair market value that is determined by local assessors to be the total taxable value of land and additions on the property. | Land | Improvement |
|---|---|---|---|---|
| 2025 | $869 | $110,498 | $0 | $0 |
| 2024 | $869 | $110,498 | $0 | $0 |
| 2023 | $998 | $97,089 | $0 | $0 |
| 2022 | $977 | $97,089 | $0 | $0 |
| 2021 | $914 | $97,089 | $0 | $0 |
| 2020 | $914 | $97,089 | $0 | $0 |
| 2019 | $914 | $292,077 | $265,434 | $26,643 |
| 2018 | $946 | $360,365 | $333,722 | $26,643 |
| 2016 | $1,361 | $318,574 | $285,209 | $33,365 |
| 2015 | $1,218 | $318,574 | $285,209 | $33,365 |
| 2013 | -- | $318,574 | $285,209 | $33,365 |
Source: Public Records
Map
Nearby Homes
- 2536 Enon Rd
- 2605 Joe Pruitt Rd
- 5148 Lucy Averette Rd
- 5606 Oakley Hill
- 6049 Mulberry Ln
- 1545 Dogwood Dr
- 6063 N Carolina 96
- 2665 Bodie Currin Rd
- 5586 Shelton Creek Rd
- 115 W Quail Ridge Rd
- 609 N Country Club Dr
- 206 Cardinal Ct
- 204 Cardinal Ct
- 106 Keeneland Dr
- 201 Providence Rd
- 113 Phocian St
- 96 North St
- 301 W Thorndale Dr
- 316 Keeneland Dr
- 127 Daniel St
- 2154 Us Highway 158
- 2154 Us Highway 158
- 2154 Us Highway 158
- 5605 Farmington Dr
- 5604 Farmington Dr
- 2172 Us Highway 158
- 2176 Us Highway 158
- 5597 Farmington Dr
- 2169 Elliott St
- 2179 Us Highway 158
- 5595 Farmington Dr
- 2166 Elliott St
- 2133 Elam Currin Rd
- LOT 22 Farmington Dr
- LOT 21 Farmington Dr
- 158 Farmington Dr
- LOT 16 Farmington Dr
- 2132 Us Highway 158
- 5591 Farmington Dr
- 2144 Elam Currin Rd