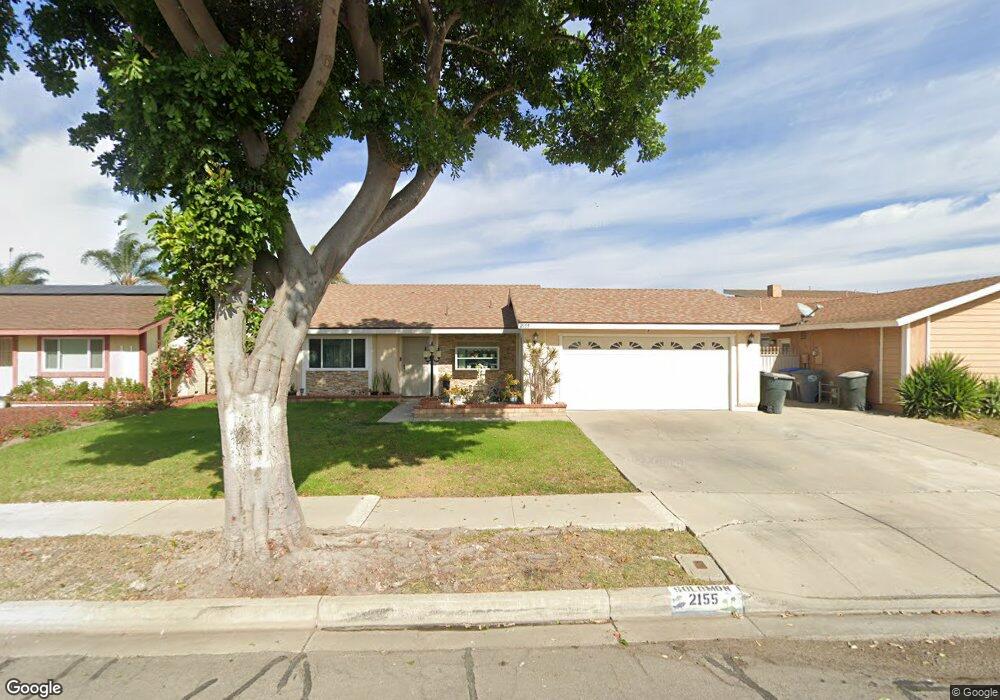
2155 Joyce Place Oxnard, CA 93033
Lemonwood Eastmont NeighborhoodEstimated Value: $634,994 - $733,000
3
Beds
2
Baths
1,076
Sq Ft
$629/Sq Ft
Est. Value
About This Home
This home is located at 2155 Joyce Place, Oxnard, CA 93033 and is currently estimated at $676,999, approximately $629 per square foot. 2155 Joyce Place is a home located in Ventura County with nearby schools including Lemonwood Elementary School and R.J. Frank Academy of Marine Science & Engineering.
Ownership History
Date
Name
Owned For
Owner Type
Purchase Details
Closed on
Jul 26, 2006
Sold by
Solomon Noel V
Bought by
Donelson Solomon Sonia O
Current Estimated Value
Home Financials for this Owner
Home Financials are based on the most recent Mortgage that was taken out on this home.
Original Mortgage
$370,000
Outstanding Balance
$217,398
Interest Rate
6.37%
Mortgage Type
New Conventional
Estimated Equity
$459,601
Purchase Details
Closed on
Mar 27, 2002
Sold by
Laughter Fredielyn and Donelson Solomon Sonia O
Bought by
Solomon Noel and Donelson Solomon Sonia O
Home Financials for this Owner
Home Financials are based on the most recent Mortgage that was taken out on this home.
Original Mortgage
$194,400
Interest Rate
7.08%
Purchase Details
Closed on
Apr 10, 2000
Sold by
Agtarap Fernando I
Bought by
Laughter Fredielyn and Donelson Sonia O
Home Financials for this Owner
Home Financials are based on the most recent Mortgage that was taken out on this home.
Original Mortgage
$185,250
Interest Rate
8.25%
Create a Home Valuation Report for This Property
The Home Valuation Report is an in-depth analysis detailing your home's value as well as a comparison with similar homes in the area
Home Values in the Area
Average Home Value in this Area
Purchase History
| Date | Buyer | Sale Price | Title Company |
|---|---|---|---|
| Donelson Solomon Sonia O | -- | Fidelity National Title | |
| Solomon Noel | -- | Fidelity National Title Co | |
| Laughter Fredielyn | $195,000 | Chicago Title Co |
Source: Public Records
Mortgage History
| Date | Status | Borrower | Loan Amount |
|---|---|---|---|
| Open | Donelson Solomon Sonia O | $370,000 | |
| Closed | Solomon Noel | $194,400 | |
| Closed | Laughter Fredielyn | $185,250 |
Source: Public Records
Tax History
| Year | Tax Paid | Tax Assessment Tax Assessment Total Assessment is a certain percentage of the fair market value that is determined by local assessors to be the total taxable value of land and additions on the property. | Land | Improvement |
|---|---|---|---|---|
| 2025 | $4,041 | $330,796 | $132,316 | $198,480 |
| 2024 | $4,041 | $324,310 | $129,721 | $194,589 |
| 2023 | $3,894 | $317,951 | $127,177 | $190,774 |
| 2022 | $3,778 | $311,717 | $124,683 | $187,034 |
| 2021 | $3,748 | $305,605 | $122,238 | $183,367 |
| 2020 | $3,817 | $302,474 | $120,986 | $181,488 |
| 2019 | $3,710 | $296,544 | $118,614 | $177,930 |
| 2018 | $3,658 | $290,731 | $116,289 | $174,442 |
| 2017 | $3,473 | $285,031 | $114,009 | $171,022 |
| 2016 | $3,353 | $279,443 | $111,774 | $167,669 |
| 2015 | $3,388 | $275,247 | $110,096 | $165,151 |
| 2014 | $3,351 | $269,858 | $107,941 | $161,917 |
Source: Public Records
Map
Nearby Homes
- 1928 San Benito St
- 1407 Peach Ave Unit 14
- 3700 Olds Rd Unit 38
- 3700 Olds Rd Unit 86
- 2151 E Wooley Rd
- 2178 Thrush Ave Unit J
- 2117 Cardinal Ave Unit 2117h
- 1657 Lime Ave Unit 87
- 1645 Lime Ave Unit 91
- 2177 Robin Ave Unit 2177A
- 2400 E Pleasant Valley Rd Unit 108
- 4108 Ranchita Ln
- 3130 Paula St
- 4200 Browning Dr
- 3151 Fournier St
- 860 Morro Way
- 4340 Highland Ave
- 211 Featherstone St
- 3631 La Costa Place
- 225 W Iris St
- 2161 Joyce Place
- 2151 Joyce Place
- 2154 Hancock Place
- 2150 Hancock Place
- 2160 Hancock Place
- 2165 Joyce Place
- 2145 Joyce Place
- 2154 Joyce Place
- 2144 Hancock Place
- 2164 Hancock Place
- 2160 Joyce Place
- 2150 Joyce Place
- 2164 Joyce Place
- 2141 Joyce Place
- 2171 Joyce Place
- 2144 Joyce Place
- 2140 Hancock Place
- 2170 Hancock Place
- 2170 Joyce Place
- 2140 Joyce Place
Your Personal Tour Guide
Ask me questions while you tour the home.