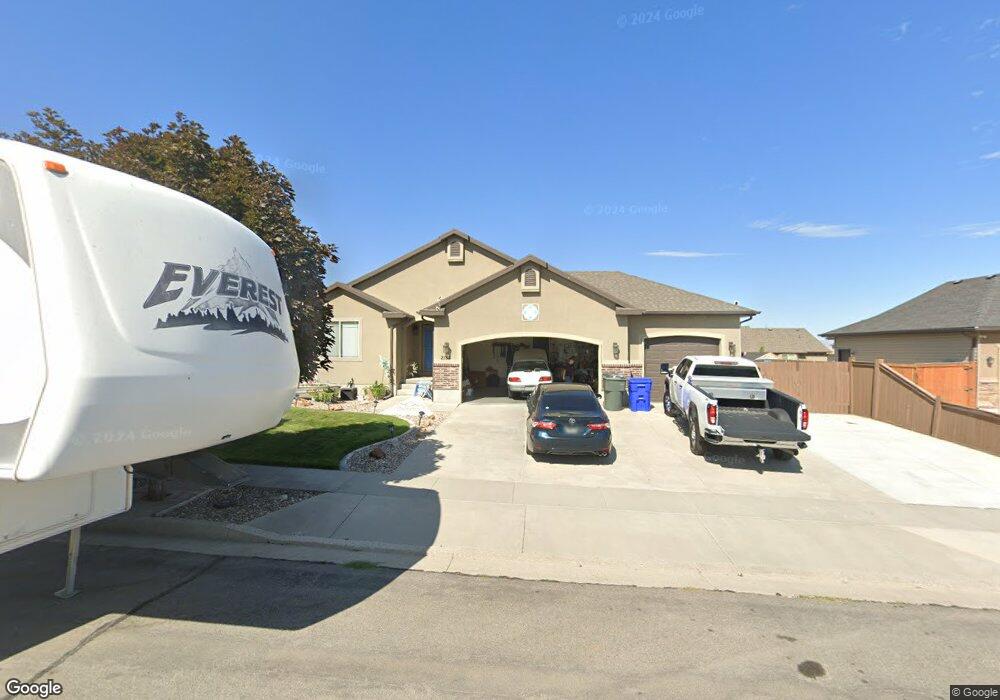
2155 N 50 W Tooele, UT 84074
Estimated Value: $486,000 - $509,000
6
Beds
3
Baths
2,748
Sq Ft
$180/Sq Ft
Est. Value
About This Home
This home is located at 2155 N 50 W, Tooele, UT 84074 and is currently estimated at $493,861, approximately $179 per square foot. 2155 N 50 W is a home located in Tooele County with nearby schools including Overlake Elementary School, Clarke N. Johnsen Junior High School, and Stansbury High School.
Ownership History
Date
Name
Owned For
Owner Type
Purchase Details
Closed on
May 6, 2022
Sold by
Arnold Stephenson
Bought by
Stephenson Arnold Eric and Stephenson Shelli F
Current Estimated Value
Home Financials for this Owner
Home Financials are based on the most recent Mortgage that was taken out on this home.
Original Mortgage
$78,000
Outstanding Balance
$62,652
Interest Rate
3.63%
Mortgage Type
New Conventional
Estimated Equity
$431,209
Purchase Details
Closed on
Nov 13, 2018
Sold by
Hubrich Jeffrey T and Hubrich Heather
Bought by
Stephenson Arnold and Stephenson Shelli
Purchase Details
Closed on
Nov 4, 2013
Sold by
Hubrich Jeffrey T
Bought by
Hubrich Jeffrey T and Hubrich Heather
Home Financials for this Owner
Home Financials are based on the most recent Mortgage that was taken out on this home.
Original Mortgage
$223,100
Interest Rate
4.27%
Mortgage Type
New Conventional
Purchase Details
Closed on
Apr 13, 2010
Sold by
Hallmark Homes And Developments
Bought by
Mcgee David K and Mcgee Jennifer L
Home Financials for this Owner
Home Financials are based on the most recent Mortgage that was taken out on this home.
Original Mortgage
$198,979
Interest Rate
4.95%
Mortgage Type
New Conventional
Create a Home Valuation Report for This Property
The Home Valuation Report is an in-depth analysis detailing your home's value as well as a comparison with similar homes in the area
Purchase History
| Date | Buyer | Sale Price | Title Company |
|---|---|---|---|
| Stephenson Arnold Eric | -- | Meridian Title | |
| Stephenson Arnold | -- | Inwest Title Tooele Office | |
| Hubrich Jeffrey T | -- | Equity Title West Jordan | |
| Hubrich Jeffrey T | -- | Inwest Title Tooele Office | |
| Mcgee David K | -- | Metro National Title |
Source: Public Records
Mortgage History
| Date | Status | Borrower | Loan Amount |
|---|---|---|---|
| Open | Stephenson Arnold Eric | $78,000 | |
| Previous Owner | Hubrich Jeffrey T | $223,100 | |
| Previous Owner | Mcgee David K | $198,979 |
Source: Public Records
Tax History
| Year | Tax Paid | Tax Assessment Tax Assessment Total Assessment is a certain percentage of the fair market value that is determined by local assessors to be the total taxable value of land and additions on the property. | Land | Improvement |
|---|---|---|---|---|
| 2025 | $3,113 | $456,259 | $105,000 | $351,259 |
| 2024 | $3,403 | $251,617 | $57,750 | $193,867 |
| 2023 | $3,403 | $265,316 | $54,996 | $210,320 |
| 2022 | $2,652 | $219,127 | $68,200 | $150,927 |
| 2021 | $2,747 | $188,708 | $22,000 | $166,708 |
| 2020 | $2,567 | $310,630 | $40,000 | $270,630 |
| 2019 | $2,486 | $297,743 | $40,000 | $257,743 |
| 2018 | $2,121 | $241,715 | $40,000 | $201,715 |
| 2017 | $1,695 | $228,519 | $40,000 | $188,519 |
| 2016 | $1,512 | $112,559 | $16,500 | $96,059 |
| 2015 | $1,512 | $107,237 | $0 | $0 |
| 2014 | -- | $107,237 | $0 | $0 |
Source: Public Records
Map
Nearby Homes
- 2124 N 90 W
- 2129 N Berra Blvd
- 2184 N 170 W
- 2042 N Essie Dr
- 81 W 1930 N
- 1909 N 70 W
- 1893 N 70 W
- 2297 N 250 W
- 88 Aparicio Dr
- 377 W 2030 N
- 2098 N 425 W
- 2157 N 425 W
- 1742 N 80 E
- 2067 N 450 W Unit 206
- 2067 N 450 W
- 1651 N 40 E
- 1648 Dawson Ln
- 58 W 1570 N
- 522 W 1910 N Unit 309
- 533 W South Temple St Unit 309
Your Personal Tour Guide
Ask me questions while you tour the home.