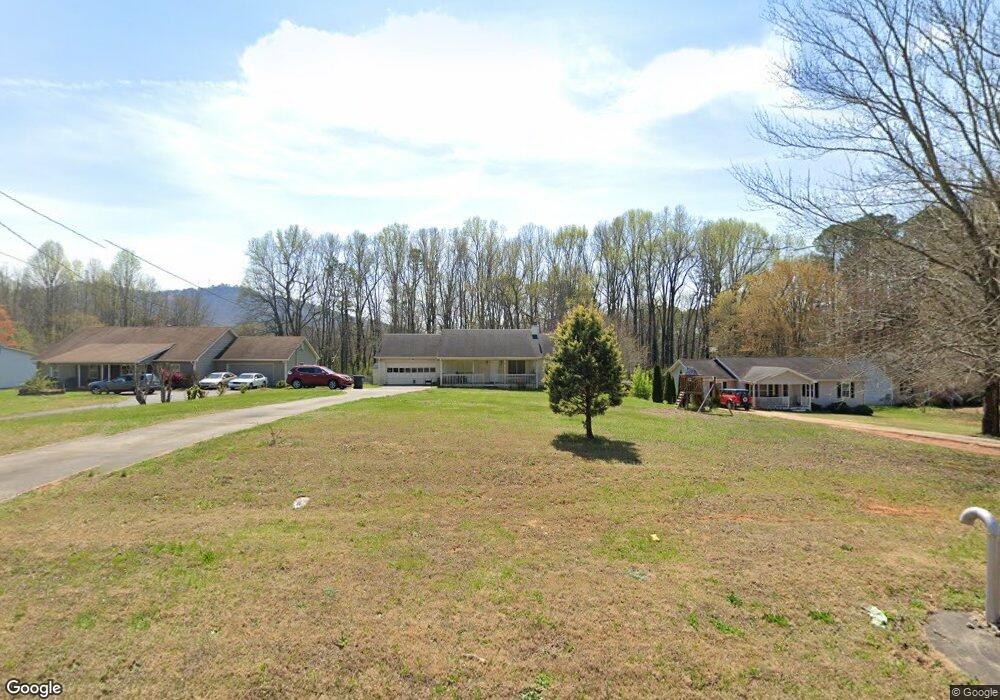
2155 Roper Rd Cumming, GA 30028
Estimated Value: $331,000 - $427,000
3
Beds
2
Baths
1,292
Sq Ft
$280/Sq Ft
Est. Value
About This Home
This home is located at 2155 Roper Rd, Cumming, GA 30028 and is currently estimated at $362,331, approximately $280 per square foot. 2155 Roper Rd is a home located in Forsyth County with nearby schools including Sawnee Elementary School, Otwell Middle School, and Forsyth Central High School.
Ownership History
Date
Name
Owned For
Owner Type
Purchase Details
Closed on
Jul 25, 2005
Sold by
Smith Ross W and Smith Helga
Bought by
Chavez Valentin R
Current Estimated Value
Home Financials for this Owner
Home Financials are based on the most recent Mortgage that was taken out on this home.
Original Mortgage
$147,335
Outstanding Balance
$76,563
Interest Rate
5.59%
Mortgage Type
VA
Estimated Equity
$285,768
Purchase Details
Closed on
Jul 30, 1999
Sold by
Fowler Barbara K
Bought by
Smith Ross W and Smith Helga
Home Financials for this Owner
Home Financials are based on the most recent Mortgage that was taken out on this home.
Original Mortgage
$122,570
Interest Rate
7.66%
Mortgage Type
VA
Purchase Details
Closed on
Apr 15, 1993
Sold by
Carl Spalding Associates
Bought by
Coggins Barbara Kay
Home Financials for this Owner
Home Financials are based on the most recent Mortgage that was taken out on this home.
Original Mortgage
$75,900
Interest Rate
7.47%
Create a Home Valuation Report for This Property
The Home Valuation Report is an in-depth analysis detailing your home's value as well as a comparison with similar homes in the area
Home Values in the Area
Average Home Value in this Area
Purchase History
| Date | Buyer | Sale Price | Title Company |
|---|---|---|---|
| Chavez Valentin R | $148,500 | -- | |
| Smith Ross W | $119,000 | -- | |
| Coggins Barbara Kay | $79,900 | -- |
Source: Public Records
Mortgage History
| Date | Status | Borrower | Loan Amount |
|---|---|---|---|
| Open | Chavez Valentin R | $147,335 | |
| Previous Owner | Smith Ross W | $122,570 | |
| Previous Owner | Coggins Barbara Kay | $75,900 |
Source: Public Records
Tax History Compared to Growth
Tax History
| Year | Tax Paid | Tax Assessment Tax Assessment Total Assessment is a certain percentage of the fair market value that is determined by local assessors to be the total taxable value of land and additions on the property. | Land | Improvement |
|---|---|---|---|---|
| 2025 | $2,469 | $133,236 | $46,000 | $87,236 |
| 2024 | $2,469 | $127,984 | $44,000 | $83,984 |
| 2023 | $2,141 | $129,804 | $40,000 | $89,804 |
| 2022 | $1,837 | $83,936 | $28,000 | $55,936 |
| 2021 | $1,980 | $83,936 | $28,000 | $55,936 |
| 2020 | $1,807 | $75,568 | $22,000 | $53,568 |
| 2019 | $1,790 | $74,596 | $22,000 | $52,596 |
| 2018 | $1,641 | $66,948 | $22,000 | $44,948 |
| 2017 | $1,667 | $67,848 | $22,000 | $45,848 |
| 2016 | $1,397 | $55,088 | $14,000 | $41,088 |
| 2015 | $1,400 | $55,088 | $14,000 | $41,088 |
| 2014 | $1,259 | $51,684 | $0 | $0 |
Source: Public Records
Map
Nearby Homes
- 2275 Doctor Bramblett Rd
- 2165 Robin Hood Trail
- 2725 Yellowstone Farm Dr
- 2615 Yellowstone Farm Dr
- 2755 Marie Way
- 2765 Marie Way
- 3115 Corsair Curve
- 2775 Marie Way
- 4900 Spot Rd
- 2545 Little John Ln
- 3085 Aldrich Dr
- 2840 Astoria Ave
- 2795 Roper Rd
- 5340 Memento Trace
- 2830 Gramercy Ct
- 1565 Dr Bramblett Rd
- 1735 Gordon Rd
- 4985 Mccoy Cir
- 2145 Roper Rd
- 2165 Roper Rd
- 2135 Roper Rd
- 2175 Roper Rd
- 2185 Roper Rd
- 2140 Roper Rd
- 2195 Roper Rd
- 2110 Roper Rd
- 2150 00 Roper Rd
- 2150 0 Roper Rd
- 2125 Dr Bramblett Rd
- 2015 Doctor Bramblett Rd
- 2215 Roper Rd
- 2025 Dr Bramblett Rd
- 2010 Friar Tuck Ct
- 2015 Friar Tuck Ct
- 2303 Roper Rd
- 2115 Robin Hood Trail
- 2310 Roper Rd