
Seller's Agent in 2025
Cory Jones
eXp Realty - St. Charles
(630) 400-9009
2 in this area
340 Total Sales
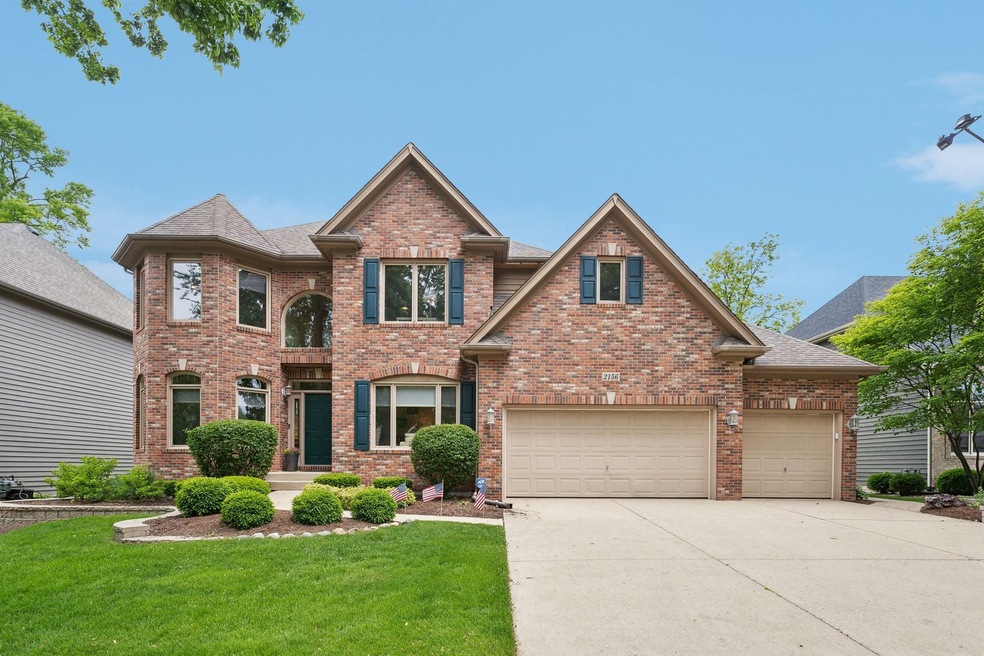
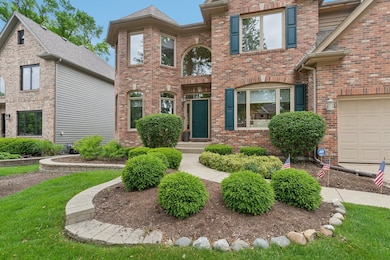
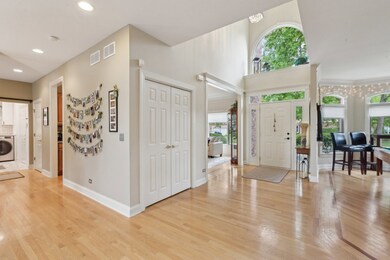
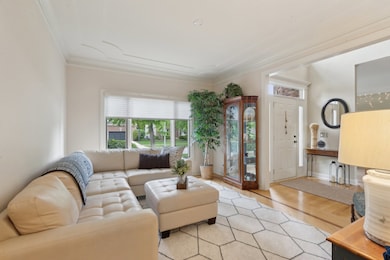
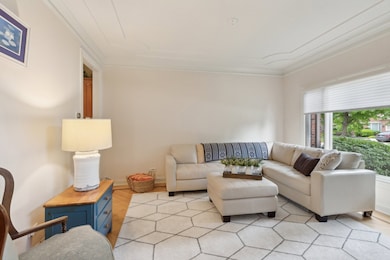

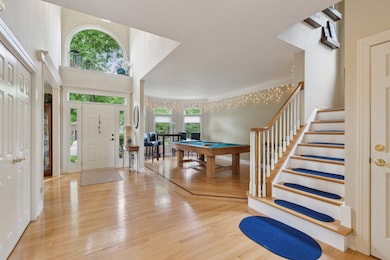
Welcome to 2156 Red Maple Lane-a beautifully updated home in the sought-after Ginger Woods neighborhood. From the moment you step inside, you'll appreciate the natural light, thoughtful layout, and stylish finishes that make this home both functional and inviting. The two-story foyer sets the tone, leading into a bright living room with crown molding and a formal dining room. Hardwood floors run throughout the first and second levels, adding warmth and continuity to the space. At the heart of the home is a stunning kitchen featuring granite countertops, a tile backsplash, stainless steel appliances, an island, and a spacious pantry. The eat-in area overlooks the backyard and flows seamlessly into the large family room with soaring ceilings and a dramatic floor-to-ceiling brick fireplace. One of the standout features of the main level is the newly renovated laundry/mudroom-designed with custom finishes that combine style and function. There's also a versatile office or den, perfect for working from home. Upstairs you will find three bedrooms plus the primary suite that offers a relaxing retreat with a tray ceiling, dual closets, and a luxurious bath with double sinks, a large shower, and a jetted tub. The finished basement adds even more living space with a 5th bedroom, full bath, large rec area, bar, and plenty of storage. Plenty of storage! Step outside to enjoy the professionally landscaped backyard with a spacious brick paver patio and outdoor lighting-ideal for entertaining or relaxing. Three car garage and EV hook up! Located in the highly rated Batavia 101 school district and close to parks, the Illinois Prairie Path, I-88, the Metra, and local shopping and dining, this home is move-in ready and a great value in a prime location.
Last Agent to Sell the Property
eXp Realty - St. Charles License #475122035 Listed on: 06/05/2025
| Date | Type | Sale Price | Title Company |
|---|---|---|---|
| Warranty Deed | $740,000 | First American Title Insurance | |
| Deed | $500,000 | None Available | |
| Warranty Deed | $400,500 | Chicago Title Insurance Co |
| Date | Status | Loan Amount | Loan Type |
|---|---|---|---|
| Open | $584,600 | New Conventional | |
| Previous Owner | $300,000 | New Conventional | |
| Previous Owner | $320,320 | Purchase Money Mortgage |
| Date | Event | Price | List to Sale | Price per Sq Ft |
|---|---|---|---|---|
| 08/15/2025 08/15/25 | Sold | $740,000 | -1.3% | $241 / Sq Ft |
| 06/30/2025 06/30/25 | Pending | -- | -- | -- |
| 06/05/2025 06/05/25 | For Sale | $750,000 | -- | $244 / Sq Ft |
| Year | Tax Paid | Tax Assessment Tax Assessment Total Assessment is a certain percentage of the fair market value that is determined by local assessors to be the total taxable value of land and additions on the property. | Land | Improvement |
|---|---|---|---|---|
| 2024 | $15,157 | $184,558 | $41,377 | $143,181 |
| 2023 | $14,790 | $164,902 | $36,970 | $127,932 |
| 2022 | $14,950 | $160,842 | $33,732 | $127,110 |
| 2021 | $14,208 | $149,746 | $31,405 | $118,341 |
| 2020 | $15,373 | $160,484 | $29,171 | $131,313 |
| 2019 | $14,603 | $148,693 | $27,028 | $121,665 |
| 2018 | $13,764 | $140,750 | $27,133 | $113,617 |
| 2017 | $14,536 | $145,460 | $23,332 | $122,128 |
| 2016 | $16,316 | $159,222 | $25,307 | $133,915 |
| 2015 | -- | $142,031 | $21,762 | $120,269 |
| 2014 | -- | $131,092 | $20,930 | $110,162 |
| 2013 | -- | $129,225 | $20,632 | $108,593 |
Seller's Agent in 2025
Cory Jones
eXp Realty - St. Charles
(630) 400-9009
2 in this area
340 Total Sales
Seller Co-Listing Agent in 2025
Anna VanBroeck
eXp Realty - St. Charles
(630) 400-9009
1 in this area
59 Total Sales
Source: Midwest Real Estate Data (MRED)
MLS Number: 12377260
APN: 15-01-230-013
Disclaimer: Certain information contained herein is derived from information provided by parties other than Homes.com. All information provided is deemed reliable, but is not guaranteed to be accurate and should be independently verified.
![]() Based on information submitted to the MLS GRID. All data is obtained from various sources and may not have been verified by broker or MLS GRID. Supplied Open House Information is subject to change without notice. All information should be independently reviewed and verified for accuracy. Properties may or may not be listed by the office/agent presenting the information. Some IDX listings have been excluded from this website.
Based on information submitted to the MLS GRID. All data is obtained from various sources and may not have been verified by broker or MLS GRID. Supplied Open House Information is subject to change without notice. All information should be independently reviewed and verified for accuracy. Properties may or may not be listed by the office/agent presenting the information. Some IDX listings have been excluded from this website.
Based on information submitted to the MLS GRID
Ask me questions while you tour the home.