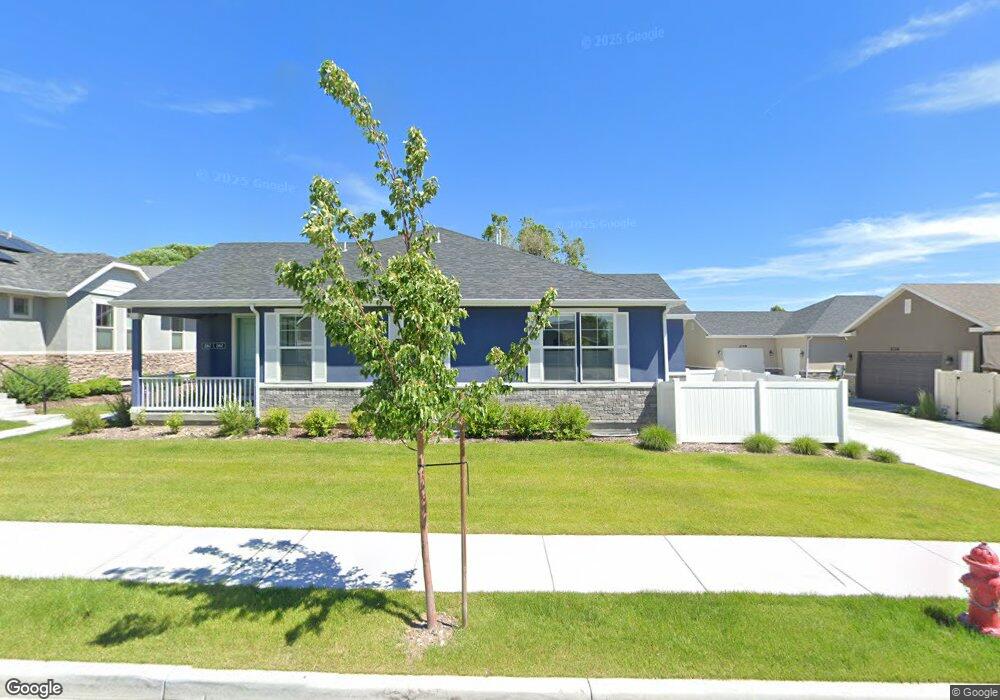
2156 W Kimber Ln Unit 6 Riverton, UT 84065
Estimated Value: $566,000 - $658,000
2
Beds
2
Baths
3,017
Sq Ft
$198/Sq Ft
Est. Value
About This Home
This home is located at 2156 W Kimber Ln Unit 6, Riverton, UT 84065 and is currently estimated at $598,496, approximately $198 per square foot. 2156 W Kimber Ln Unit 6 is a home located in Salt Lake County with nearby schools including Rosamond Elementary School, Oquirrh Hills Middle School, and Riverton High School.
Ownership History
Date
Name
Owned For
Owner Type
Purchase Details
Closed on
Apr 4, 2016
Sold by
Holmes Homes Inc
Bought by
Holmes Polester Riverton Llc
Current Estimated Value
Home Financials for this Owner
Home Financials are based on the most recent Mortgage that was taken out on this home.
Original Mortgage
$232,000
Outstanding Balance
$184,128
Interest Rate
3.65%
Mortgage Type
New Conventional
Estimated Equity
$414,368
Purchase Details
Closed on
Apr 1, 2016
Sold by
Holmes Polester Riverton Llc
Bought by
Riddle Jillyn D
Home Financials for this Owner
Home Financials are based on the most recent Mortgage that was taken out on this home.
Original Mortgage
$232,000
Outstanding Balance
$184,128
Interest Rate
3.65%
Mortgage Type
New Conventional
Estimated Equity
$414,368
Purchase Details
Closed on
Jul 22, 2015
Sold by
Iiolmes Homes Inc
Bought by
Holmes Polestar Riverton Llc
Purchase Details
Closed on
Jul 10, 2015
Sold by
Polostar Capital Riverton Llc
Bought by
Holmes Homes Inc
Create a Home Valuation Report for This Property
The Home Valuation Report is an in-depth analysis detailing your home's value as well as a comparison with similar homes in the area
Home Values in the Area
Average Home Value in this Area
Purchase History
| Date | Buyer | Sale Price | Title Company |
|---|---|---|---|
| Holmes Polester Riverton Llc | -- | Meridian Title | |
| Riddle Jillyn D | -- | Meridian Title | |
| Holmes Polestar Riverton Llc | -- | Accommodation | |
| Holmes Homes Inc | -- | Meridian Title |
Source: Public Records
Mortgage History
| Date | Status | Borrower | Loan Amount |
|---|---|---|---|
| Open | Riddle Jillyn D | $232,000 |
Source: Public Records
Tax History Compared to Growth
Tax History
| Year | Tax Paid | Tax Assessment Tax Assessment Total Assessment is a certain percentage of the fair market value that is determined by local assessors to be the total taxable value of land and additions on the property. | Land | Improvement |
|---|---|---|---|---|
| 2025 | $3,244 | $574,200 | $134,700 | $439,500 |
| 2024 | $3,244 | $561,400 | $132,300 | $429,100 |
| 2023 | $3,244 | $515,700 | $122,500 | $393,200 |
| 2022 | $3,294 | $527,200 | $120,100 | $407,100 |
| 2021 | $2,854 | $406,700 | $90,000 | $316,700 |
| 2020 | $2,751 | $365,500 | $80,700 | $284,800 |
| 2019 | $2,753 | $359,600 | $73,400 | $286,200 |
| 2018 | $2,601 | $334,500 | $73,400 | $261,100 |
| 2017 | $2,451 | $307,200 | $73,400 | $233,800 |
| 2016 | $2,480 | $298,300 | $68,300 | $230,000 |
| 2015 | $1,014 | $65,000 | $65,000 | $0 |
Source: Public Records
Map
Nearby Homes
- 2356 W Montcalm Dr
- 12501 Falls Creek Rd
- 12900 S 2200 W
- 12345 S Redwood Rd
- 2048 W 12920 S
- 12325 S Redwood Rd
- 12317 S Redwood Rd
- 1056 W Kate Springs Ln S Unit 10
- 1661 W Madison View Dr
- 2036 W 13035 S
- 12034 S 1900 W
- 2249 W 13035 S
- 1560 W 12730 S
- 12294 S 1490 W
- 1373 W Stewart Falls Dr
- 1371 W Stewart Falls Dr
- 2106 W 13220 S
- 2295 W Myers Ln
- 1721 W Hollow Cedar Ln Unit 1
- 1410 W 12115 S
- 2156 W Kimber Ln Unit 5
- 2162 W Kimber Ln Unit 5
- 2162 W Kimber Ln Unit 16
- 2162 W Kimber Ln
- 2176 W Kimber Ln Unit 3
- 2176 W Kimber Ln
- 2148 W Kimber Ln
- 2168 W Kimber Ln Unit 4
- 2168 W Kimber Ln
- 2153 W 12510 S
- 2136 W Kimber Ln
- 2177 W 12510 S
- 2129 W 12510 S
- 2184 W Kimber Ln Unit 2
- 2126 W Kimber Ln
- 2126 W Kimber Ln Unit 11
- 2132 W Kimber Ln
- 2192 W Kimber Ln Unit 20
- 2192 W Kimber Ln Unit 1
- 2161 W Kimber Ln Unit 42