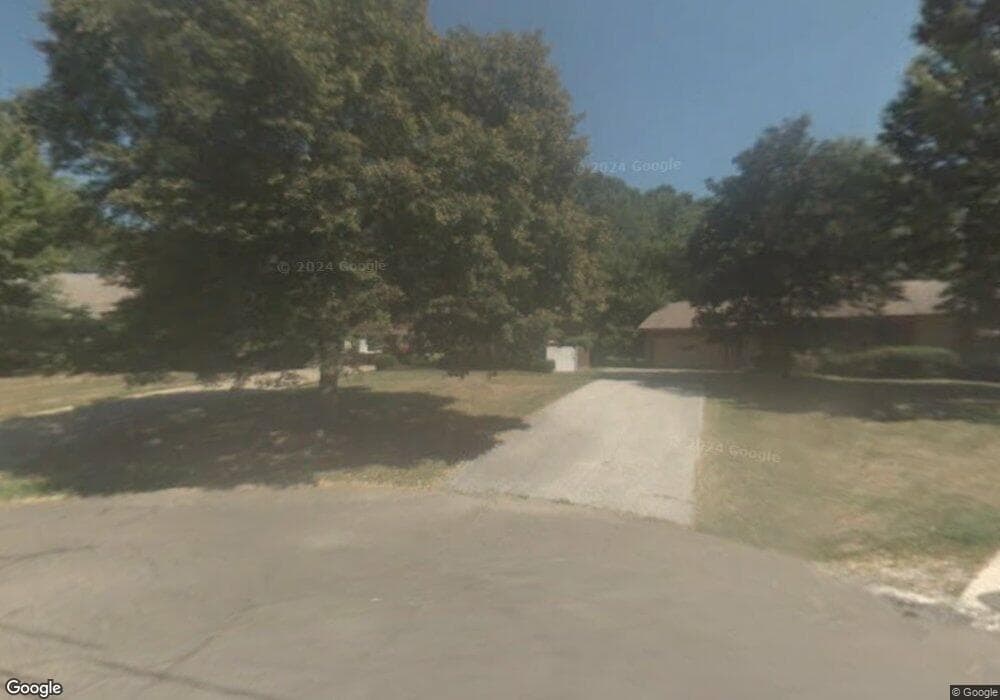
2157 Waynoka Rd Euclid, OH 44117
Estimated Value: $160,000 - $185,841
3
Beds
2
Baths
1,366
Sq Ft
$125/Sq Ft
Est. Value
About This Home
This home is located at 2157 Waynoka Rd, Euclid, OH 44117 and is currently estimated at $170,460, approximately $124 per square foot. 2157 Waynoka Rd is a home located in Cuyahoga County with nearby schools including Bluestone Elementary School, Euclid Middle School, and Euclid High School.
Ownership History
Date
Name
Owned For
Owner Type
Purchase Details
Closed on
Oct 29, 1998
Sold by
Talley Edward L and Talley Shonna Y
Bought by
Johnson Pamela S
Current Estimated Value
Home Financials for this Owner
Home Financials are based on the most recent Mortgage that was taken out on this home.
Original Mortgage
$90,800
Outstanding Balance
$20,151
Interest Rate
6.78%
Estimated Equity
$150,309
Purchase Details
Closed on
Apr 21, 1998
Sold by
Sec Of H U D
Bought by
Talley Edward L and Talley Shonna Y
Home Financials for this Owner
Home Financials are based on the most recent Mortgage that was taken out on this home.
Original Mortgage
$85,500
Interest Rate
7.26%
Purchase Details
Closed on
Aug 27, 1993
Sold by
Deihl Robert M
Bought by
Wolpaw Ilda C
Purchase Details
Closed on
Dec 27, 1989
Sold by
Sheets Helen P
Bought by
Deihl Robert M
Purchase Details
Closed on
Dec 3, 1979
Sold by
Sheets Warren M and Sheets Helen P
Bought by
Sheets Helen P
Purchase Details
Closed on
Jan 1, 1975
Bought by
Sheets Warren M and Sheets Helen P
Create a Home Valuation Report for This Property
The Home Valuation Report is an in-depth analysis detailing your home's value as well as a comparison with similar homes in the area
Home Values in the Area
Average Home Value in this Area
Purchase History
| Date | Buyer | Sale Price | Title Company |
|---|---|---|---|
| Johnson Pamela S | $113,500 | Gateway Title Agency Inc | |
| Talley Edward L | -- | Gateway Title Agency Inc | |
| Wolpaw Ilda C | $90,100 | -- | |
| Deihl Robert M | $90,000 | -- | |
| Sheets Helen P | -- | -- | |
| Sheets Warren M | -- | -- |
Source: Public Records
Mortgage History
| Date | Status | Borrower | Loan Amount |
|---|---|---|---|
| Open | Johnson Pamela S | $90,800 | |
| Previous Owner | Talley Edward L | $85,500 |
Source: Public Records
Tax History Compared to Growth
Tax History
| Year | Tax Paid | Tax Assessment Tax Assessment Total Assessment is a certain percentage of the fair market value that is determined by local assessors to be the total taxable value of land and additions on the property. | Land | Improvement |
|---|---|---|---|---|
| 2024 | $3,394 | $49,315 | $12,040 | $37,275 |
| 2023 | $3,421 | $39,840 | $9,420 | $30,420 |
| 2022 | $3,342 | $39,830 | $9,420 | $30,420 |
| 2021 | $3,720 | $39,830 | $9,420 | $30,420 |
| 2020 | $3,119 | $30,170 | $7,140 | $23,030 |
| 2019 | $2,805 | $86,200 | $20,400 | $65,800 |
| 2018 | $2,752 | $30,170 | $7,140 | $23,030 |
| 2017 | $2,899 | $25,770 | $5,640 | $20,130 |
| 2016 | $2,905 | $25,770 | $5,640 | $20,130 |
| 2015 | $2,644 | $25,770 | $5,640 | $20,130 |
| 2014 | $2,644 | $25,770 | $5,640 | $20,130 |
Source: Public Records
Map
Nearby Homes
- 4002 Lancaster Rd
- 4031 Suffolk Rd
- 2536 Greenvale Rd
- 220 Greenvale Rd
- 2441 Malden Rd
- 237 Greenbriar Ct Unit F237
- 209 Greenbriar Ct
- 2150 Glenridge Rd
- 4188 Glenridge Rd
- 3803 Bridgeview Dr
- 2337 Greenvale Rd
- 3757 Princeton Blvd
- 24 Washington Square
- 565 Quilliams Rd
- 3790 Sherwood Rd
- 4019 Princeton Blvd
- 4450 Habersham Ln S Unit 201
- 3898 Salisbury Rd
- 24801 Highland Rd
- 19871 Upper Valley Dr
- 2155 Waynoka Rd
- 2159 Waynoka Rd
- 2153 Waynoka Rd
- 2161 Waynoka Rd
- 2151 Waynoka Rd
- 2152 Waynoka Rd
- 2154 Waynoka Rd
- 2156 Waynoka Rd
- 2149 Waynoka Rd
- 2145 Miami Rd
- 2147 Waynoka Rd
- 2142 Miami Rd
- 2143 Miami Rd
- 2145 Waynoka Rd
- 2140 Miami Rd
- 2139 Miami Rd
- 2143 Waynoka Rd
- 2295 Green Rd
- 2144 Waynoka Rd
- 2137 Miami Rd