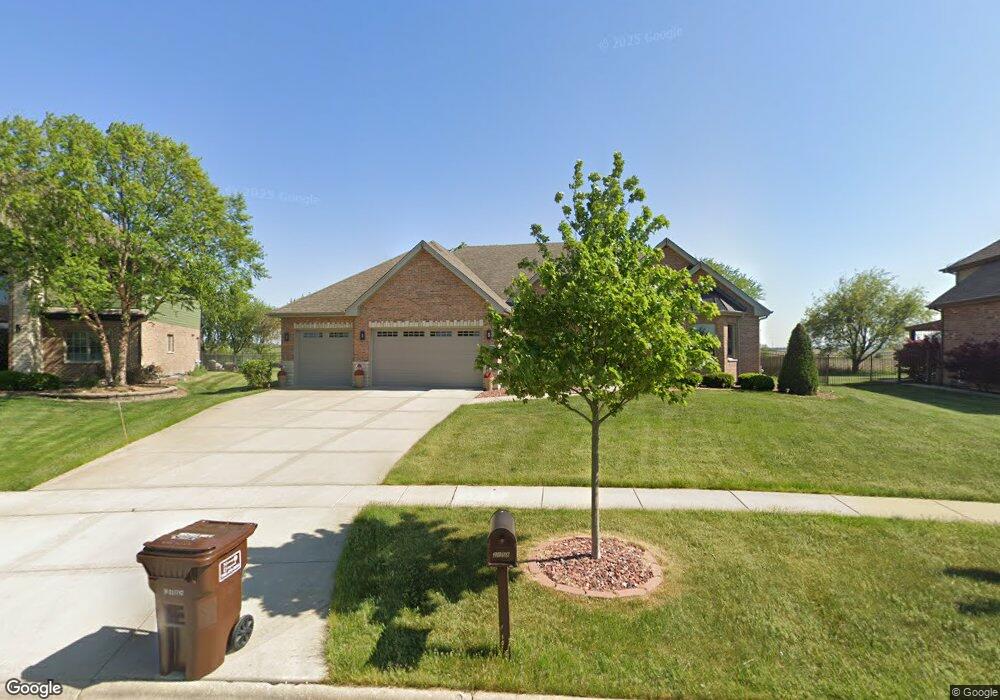
2158 Edgeview Dr New Lenox, IL 60451
Estimated Value: $603,242 - $732,000
--
Bed
--
Bath
--
Sq Ft
0.4
Acres
About This Home
This home is located at 2158 Edgeview Dr, New Lenox, IL 60451 and is currently estimated at $666,811. 2158 Edgeview Dr is a home with nearby schools including Spencer Trail, Spencer Pointe, and Spencer Crossing Intermediate School.
Ownership History
Date
Name
Owned For
Owner Type
Purchase Details
Closed on
Dec 15, 2014
Sold by
Lynn Builders Inc
Bought by
Clarke George
Current Estimated Value
Home Financials for this Owner
Home Financials are based on the most recent Mortgage that was taken out on this home.
Original Mortgage
$373,561
Outstanding Balance
$284,339
Interest Rate
3.75%
Mortgage Type
VA
Estimated Equity
$382,472
Purchase Details
Closed on
Sep 13, 2013
Sold by
Lynn Development Llc
Bought by
Lynn Builders Inc
Purchase Details
Closed on
Feb 24, 2011
Sold by
Pb Sw Land Llc
Bought by
Lynn Development Llc
Purchase Details
Closed on
Oct 27, 2010
Sold by
The Privatebank & Trust Company
Bought by
Pb Sw Land Llc
Purchase Details
Closed on
May 22, 2007
Sold by
Harris Na
Bought by
Founders Bank and Trust #5730
Create a Home Valuation Report for This Property
The Home Valuation Report is an in-depth analysis detailing your home's value as well as a comparison with similar homes in the area
Home Values in the Area
Average Home Value in this Area
Purchase History
| Date | Buyer | Sale Price | Title Company |
|---|---|---|---|
| Clarke George | $409,979 | Chicago Title Insurance Co | |
| Lynn Builders Inc | -- | None Available | |
| Lynn Development Llc | $1,228,400 | None Available | |
| Pb Sw Land Llc | -- | None Available | |
| Founders Bank | $5,250,000 | None Available |
Source: Public Records
Mortgage History
| Date | Status | Borrower | Loan Amount |
|---|---|---|---|
| Open | Clarke George | $373,561 |
Source: Public Records
Tax History Compared to Growth
Tax History
| Year | Tax Paid | Tax Assessment Tax Assessment Total Assessment is a certain percentage of the fair market value that is determined by local assessors to be the total taxable value of land and additions on the property. | Land | Improvement |
|---|---|---|---|---|
| 2024 | $14,681 | $196,903 | $44,579 | $152,324 |
| 2023 | $14,681 | $179,492 | $40,637 | $138,855 |
| 2022 | $13,356 | $165,354 | $37,436 | $127,918 |
| 2021 | $12,665 | $155,510 | $35,207 | $120,303 |
| 2020 | $12,296 | $149,962 | $33,951 | $116,011 |
| 2019 | $11,762 | $145,312 | $32,898 | $112,414 |
| 2018 | $11,482 | $140,303 | $31,764 | $108,539 |
| 2017 | $10,903 | $136,270 | $30,851 | $105,419 |
| 2016 | $10,578 | $132,623 | $30,025 | $102,598 |
| 2015 | -- | $128,449 | $29,080 | $99,369 |
| 2014 | -- | $21,148 | $21,148 | $0 |
| 2013 | -- | $21,433 | $21,433 | $0 |
Source: Public Records
Map
Nearby Homes
- 2195 Bristol Park Rd
- 2185 Bristol Park Rd
- 2067 Edgeview Dr
- 2461 Stone Creek Dr
- 2451 Stone Creek Dr
- 2441 Stone Creek Dr
- 2421 Stone Creek Dr
- 575 Caledonia Dr
- 2401 Stone Creek Dr
- 2391 Stone Creek Dr
- Raleigh Plan at Calistoga
- Siena II Plan at Calistoga
- Galveston Plan at Calistoga
- Brooklyn Plan at Calistoga
- Ontario Plan at Calistoga
- Westbury Plan at Calistoga
- 2381 Stone Creek Dr
- 2341 Stone Creek Dr
- 2321 Stone Creek Dr
- 2331 Stone Creek Dr
- 2166 Edgeview Dr
- 2150 Edgeview Dr
- 2174 Edgeview Dr
- 2147 Edgeview Dr
- 2142 Edgeview Dr
- 2167 Edgeview Dr
- 2134 Edgeview Dr
- 2182 Edgeview Dr
- 2177 Edgeview Dr
- 2126 Edgeview Dr
- 2187 Edgeview Dr
- 2190 Edgeview Dr
- 2117 Edgeview Dr
- 2116 Edgeview Dr
- 2198 Edgeview Dr
- 2109 Edgeview Dr
- 2197 Edgeview Dr
- 2106 Edgeview Dr
- 808 Waterton Dr
- 2176 Viewside Dr