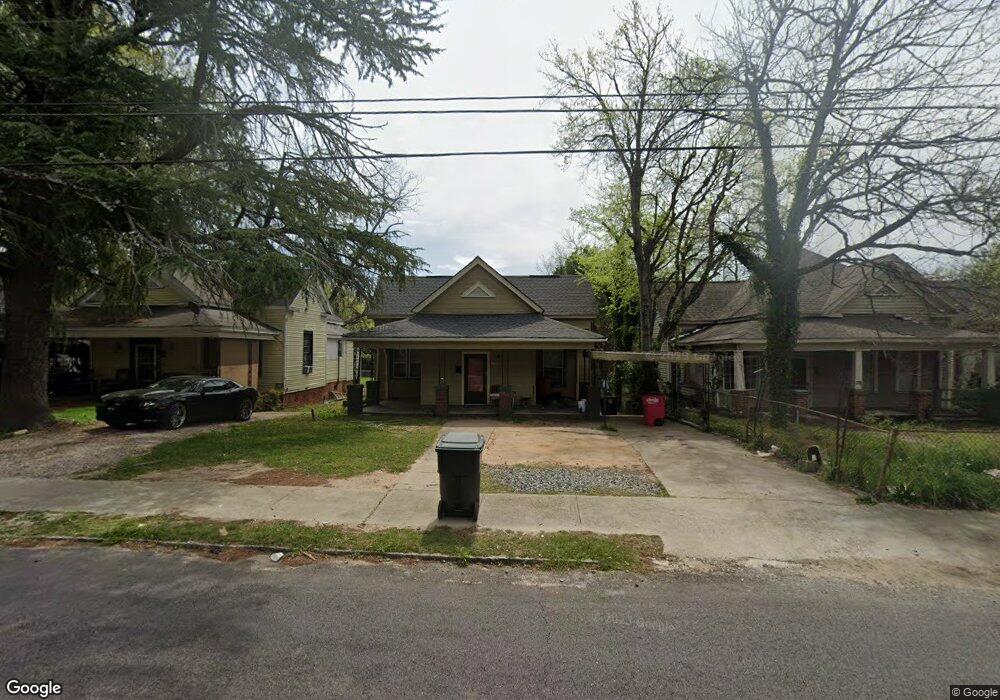
2158 Jeff Davis St Macon, GA 31201
Tindall Heights Historic District NeighborhoodEstimated Value: $86,248 - $115,000
3
Beds
2
Baths
1,429
Sq Ft
$71/Sq Ft
Est. Value
About This Home
This home is located at 2158 Jeff Davis St, Macon, GA 31201 and is currently estimated at $100,812, approximately $70 per square foot. 2158 Jeff Davis St is a home located in Bibb County with nearby schools including Ingram-Pye Elementary School, Central High School, and Cirrus Charter Academy.
Ownership History
Date
Name
Owned For
Owner Type
Purchase Details
Closed on
Sep 19, 2008
Sold by
Wallace Orlando
Bought by
Morgan Hirran
Current Estimated Value
Purchase Details
Closed on
Mar 6, 2007
Sold by
Johnson Victor
Bought by
Omni National Bank
Purchase Details
Closed on
Jun 29, 2006
Sold by
Omini National Bank
Bought by
Johnson Victor
Home Financials for this Owner
Home Financials are based on the most recent Mortgage that was taken out on this home.
Original Mortgage
$48,800
Interest Rate
6.68%
Mortgage Type
Purchase Money Mortgage
Purchase Details
Closed on
May 2, 2006
Home Financials for this Owner
Home Financials are based on the most recent Mortgage that was taken out on this home.
Original Mortgage
$48,800
Interest Rate
6.68%
Mortgage Type
Purchase Money Mortgage
Purchase Details
Closed on
Sep 30, 2004
Purchase Details
Closed on
Sep 24, 2004
Sold by
Yallta Group Llc
Bought by
Gavrilovic Dejanna
Purchase Details
Closed on
Aug 3, 2004
Purchase Details
Closed on
Dec 27, 2001
Create a Home Valuation Report for This Property
The Home Valuation Report is an in-depth analysis detailing your home's value as well as a comparison with similar homes in the area
Home Values in the Area
Average Home Value in this Area
Purchase History
| Date | Buyer | Sale Price | Title Company |
|---|---|---|---|
| Morgan Hirran | $10,500 | None Available | |
| Wallace Orlando | $6,500 | None Available | |
| Omni National Bank | $48,800 | None Available | |
| Johnson Victor | $46,500 | None Avelable | |
| -- | $46,300 | -- | |
| -- | $38,000 | -- | |
| Gavrilovic Dejanna | -- | -- | |
| Gavrilovic Dejana | -- | None Available | |
| -- | $32,900 | -- | |
| -- | $23,500 | -- |
Source: Public Records
Mortgage History
| Date | Status | Borrower | Loan Amount |
|---|---|---|---|
| Previous Owner | Johnson Victor | $48,800 |
Source: Public Records
Tax History Compared to Growth
Tax History
| Year | Tax Paid | Tax Assessment Tax Assessment Total Assessment is a certain percentage of the fair market value that is determined by local assessors to be the total taxable value of land and additions on the property. | Land | Improvement |
|---|---|---|---|---|
| 2025 | $615 | $25,006 | $2,900 | $22,106 |
| 2024 | $635 | $25,006 | $2,900 | $22,106 |
| 2023 | $635 | $25,006 | $2,900 | $22,106 |
| 2022 | $377 | $10,879 | $1,423 | $9,456 |
| 2021 | $413 | $10,879 | $1,423 | $9,456 |
| 2020 | $422 | $10,879 | $1,423 | $9,456 |
| 2019 | $426 | $10,879 | $1,423 | $9,456 |
| 2018 | $832 | $10,879 | $1,423 | $9,456 |
| 2017 | $408 | $10,879 | $1,423 | $9,456 |
| 2016 | $599 | $17,315 | $2,846 | $14,469 |
| 2015 | $848 | $17,315 | $2,846 | $14,469 |
| 2014 | $325 | $17,315 | $2,846 | $14,469 |
Source: Public Records
Map
Nearby Homes
- 2142 Jeff Davis St
- 2170 Jeff Davis St
- 2182 Jeff Davis St
- 2112 Jeff Davis St
- 2210 Knott St
- 2214 Knott St
- 2096 Jeff Davis St
- 743 Grants Chappel Alley
- 2222 Knott St
- 2205 Knott Street Ln
- 2084 Jeff Davis St
- 2135 Jeff Davis St
- 2149 Jeff Davis St
- 2173 Jeff Davis St
- 2230 Knott St
- 727 Grants Chappel Alley
- 736 Grants Chappel Alley
- 2253 Jeff Davis St
- 2221 Knott Street Ln
- 840 Tenney Ave