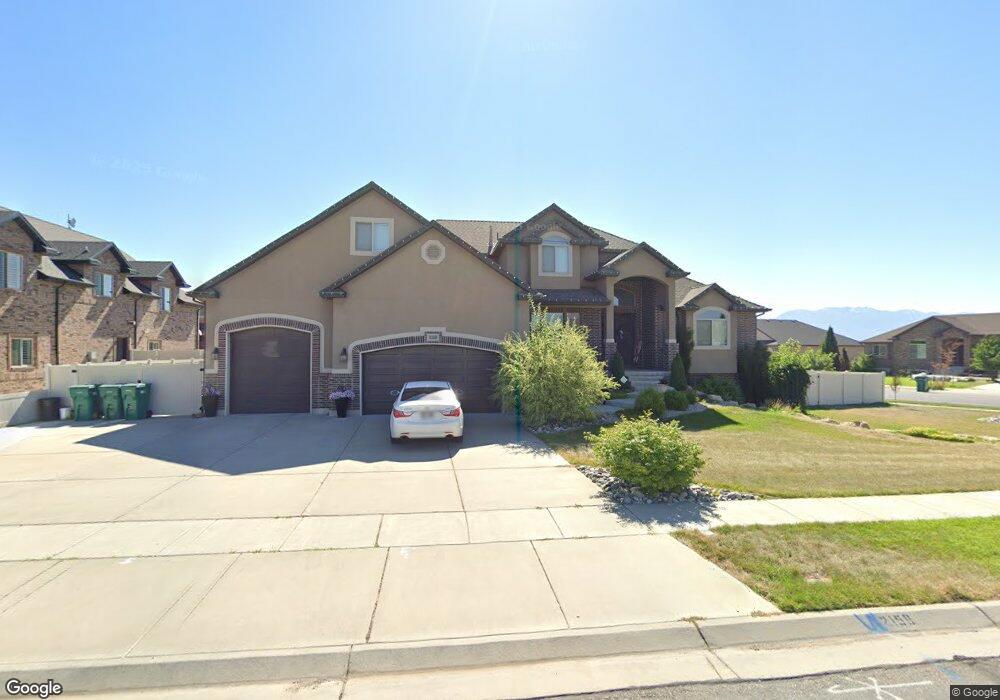
2158 S Davis Ln Unit 338 West Haven, UT 84401
Estimated Value: $810,000 - $890,000
4
Beds
3
Baths
3,090
Sq Ft
$276/Sq Ft
Est. Value
About This Home
This home is located at 2158 S Davis Ln Unit 338, West Haven, UT 84401 and is currently estimated at $853,914, approximately $276 per square foot. 2158 S Davis Ln Unit 338 is a home located in Weber County with nearby schools including Kanesville Elementary School, Rocky Mountain Junior High School, and Fremont High School.
Ownership History
Date
Name
Owned For
Owner Type
Purchase Details
Closed on
Oct 20, 2010
Sold by
Woodmere Homes Lc
Bought by
Erickson Daniel C and Erickson Bobbi J
Current Estimated Value
Home Financials for this Owner
Home Financials are based on the most recent Mortgage that was taken out on this home.
Original Mortgage
$379,511
Outstanding Balance
$249,159
Interest Rate
4.25%
Mortgage Type
FHA
Estimated Equity
$604,755
Purchase Details
Closed on
Apr 27, 2010
Sold by
Bank Of Utah
Bought by
Woodmere Homes Lc
Purchase Details
Closed on
Dec 21, 2009
Sold by
Jmr Development Llc
Bought by
Bank Of Utah
Purchase Details
Closed on
Aug 27, 2007
Sold by
Secrist Acres Development Inc
Bought by
M&D Developers Llc
Home Financials for this Owner
Home Financials are based on the most recent Mortgage that was taken out on this home.
Original Mortgage
$1,771,493
Interest Rate
6.67%
Mortgage Type
Purchase Money Mortgage
Create a Home Valuation Report for This Property
The Home Valuation Report is an in-depth analysis detailing your home's value as well as a comparison with similar homes in the area
Home Values in the Area
Average Home Value in this Area
Purchase History
| Date | Buyer | Sale Price | Title Company |
|---|---|---|---|
| Erickson Daniel C | -- | Mountain View Title Ogden | |
| Woodmere Homes Lc | -- | Mountain View Title Ogden | |
| Bank Of Utah | -- | None Available | |
| M&D Developers Llc | -- | Heritage West Title Ins |
Source: Public Records
Mortgage History
| Date | Status | Borrower | Loan Amount |
|---|---|---|---|
| Open | Erickson Daniel C | $379,511 | |
| Previous Owner | M&D Developers Llc | $1,771,493 |
Source: Public Records
Tax History Compared to Growth
Tax History
| Year | Tax Paid | Tax Assessment Tax Assessment Total Assessment is a certain percentage of the fair market value that is determined by local assessors to be the total taxable value of land and additions on the property. | Land | Improvement |
|---|---|---|---|---|
| 2025 | $4,971 | $831,731 | $227,769 | $603,962 |
| 2024 | $4,753 | $817,000 | $227,769 | $589,231 |
| 2023 | $4,977 | $860,000 | $225,565 | $634,435 |
| 2022 | $5,126 | $501,050 | $113,040 | $388,010 |
| 2021 | $3,907 | $637,000 | $134,987 | $502,013 |
| 2020 | $3,750 | $560,000 | $99,588 | $460,412 |
| 2019 | $3,585 | $505,000 | $99,299 | $405,701 |
| 2018 | $3,626 | $490,000 | $89,134 | $400,866 |
| 2017 | $3,431 | $450,000 | $87,948 | $362,052 |
| 2016 | $3,308 | $238,558 | $43,881 | $194,677 |
| 2015 | $3,248 | $232,961 | $43,881 | $189,080 |
| 2014 | $2,895 | $201,632 | $35,772 | $165,860 |
Source: Public Records
Map
Nearby Homes
- 3672 3125 W Unit 12
- 2954 W 2325 S
- 3328 W 2100 S
- 2599 S 3075 W
- 2611 W 1850 S
- 1882 S 2475 W
- 2300 Farmhouse Select Plan at Fairhaven
- 1856 S 2425 W
- 1918 S 2475 W
- 1903 S 2425 W
- 1977 S 2425 W
- 2067 S 2425 W
- 2050 Farmhouse Select Plan at Fairhaven
- 1953 S 2425 W
- 1869 S 2425 W
- 1944 S 2425 W
- 3000 Farmhouse Select Plan at Fairhaven
- 2504 W 1725 S
- 2454 W 1775 S
- 2878 2850 S
- 2128 S Davis Ln
- 3014 W 2175 S
- 2147 S Davis Ln
- 3043 W Addison Way Unit 318
- 3043 W Addison Way
- 3043 W Addison Way Unit 318
- 2171 S Davis Ln
- 2102 S Davis Ln
- 2147 S Davis Ln
- 3023 W Addison Way
- 3023 W Addison Way Unit 319
- 2115 S Davis Ln
- 3053 W Addison Way
- 2151 S 2975 W
- 2151 S 2975 W Unit 50
- 2115 S Davis Ln Unit 312
- 2115 S Davis Ln
- 2981 W Addison Way Unit 320
- 3063 W Addison Way Unit 316
- 3063 W Addison Way